
TABLE OF CONTENTS
-
- Cost Accounting 101 – Direct Labor Rates
- What Purpose is Served Using Direct Labor Rates?
- Step 1 – Collect the hourly payroll costs for each work centers
- Step 2 – Compute the new total year total wages and the number of hours you expect employees to be at work
- Step 3 – Add in other related benefits and payroll taxes to compute total costs and final labor rate
- Step 4 – Computing labor variances using a direct labor rate
Learn How to Compute Direct Labor Rates for Costing
Cost Accounting 101 – Direct Labor Rates
It is always surprising when we are introduced to a new prospective client when we discover that they do not attribute any direct labor cost in their costing process. Many of our clients are midsize, privately-held, manufacturing companies that frequently do not have the cost accounting talent on hand needed to develop the rates as well as do not understand how they would be used. In this blog post, you will learn how to compute direct labor rates, or at least one way of setting direct labor rates for a manufacturing business.
What Purpose is Served Using Direct Labor Rates?
Direct Labor Rates enable a manufacturing organization to answer two questions: 1) do we understand what it costs to deploy our direct labor work force, including both straight time, overtime, along with all associated benefits (health insurance, vacation, holidays, 401K plan, employer payroll taxes, etc.); and 2) are using utilizing our direct labor force as efficiently as planned.
Direct labor is generally one of the larger, if not the largest, components of manufacturing or conversion costs. Just as a reminder, conversion costs typically consist of direct labor, direct material, overhead, and sometimes a material overhead burden. These three or four items generally constitute the total cost of a product. A robust cost/continuous improvement process will utilize both labor rates and efficiencies to maintain a lean focus.
Step 1 – Collect the hourly payroll costs for each work centers
A direct work center is just a department that consists of predominantly factory workers that are actually touching the product. There is frequently a debate when setting standards about should supervisors be assigned to the work center or not. Typically our recommendation is to look at the amount of their time to be associated with direct production. If they are going to spend more time supervising–training, personnel oversight, etc.–then they should be assigned to an overhead department, such as Manufacturing Administration; otherwise, leave supervisors in the work center.
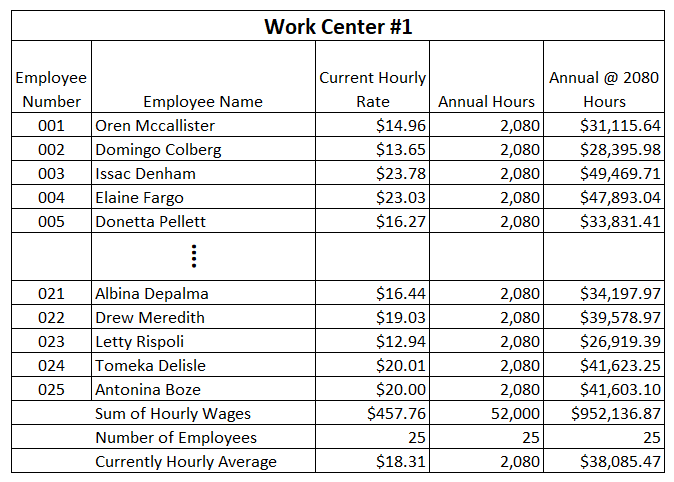
Here is our example Work Center #1. If you have multiple work centers, then you are going to want to segregate them into separate departments in your payroll and accounting systems:
GET A FREE COPY OF THE EXCEL MANUFACTURING P&L TEMPLATE BECAUSE YOU NEED TO GET STARTED TODAY!
As you can see, we have 25 employees and are listing their current hourly rates, expected total annual hours (52 weeks * 40 hours a week = 2080), and the annual wages based on the rate and expected hours. We are including the Annual hours so if there are part time employees, their wages will have the correct weighted impact to the overall average. Basically, all of calculations are going to be based on the Work Center average employee.
Step 2 – Compute the new total year total wages and the number of hours you expect employees to be at work
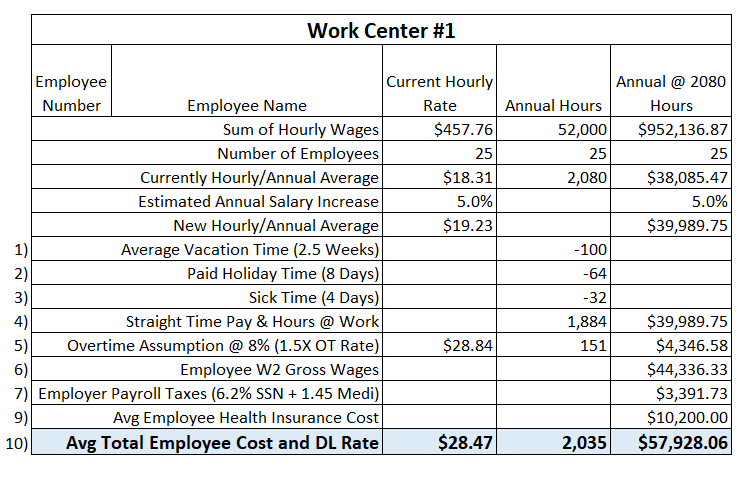
Now that we have come up with our current employee base, which will be the basis used for the new rates, we need to make a couple of adjustments. The first is adding in an expected impact for merit increases. If your company has an annual merit increase process, then this is the place to add in the impact to the merit. Here we are adding in 5%. If you think there is going to be a 5% increase, but it will not take effect until July 1st, for example, then you would want to prorate the rate by 50% and only use 2.5%. You will have an impact to your monthly variance, but your year-to-date variance will get more accurate as the year progresses.
The next step is to compute the straight time number of hours we expect each employee to be at work. Starting with the full time 2,080 hours, we reduce it by 100 hours for 2.5 weeks of vacation; 2) 64 hours for 8 days of paid holidays (New Years, Memorial Day, etc.); and 3) 32 hours for estimated sick time. You will want to adjust this for your company specifics, but the goal is to reduce the 2,080 buy the number of hours we believe each employee will be unavailable for productive work. These adjustment do not affect what we will pay each employee in total, for what will now be 1,884 hours of productive work, which is the $39,989.75 on average.
If your company experiences some level of overtime requirements, this is where to add it into the model. In our assumptions, we are guessing that the average employee will incur 8% overtime beyond their straight time hours, adding 151 hours to their productive time available. Also we need to add in the overtime compensation at 150% of their straight time rate. This means that the average employee will see $44,336.33 ($39,989.75 + $4,346.58) in the W2 at year end and they will be available for productive work 2,036 hours (1,884 @ straight time + 151 @ double time).
Step 3 – Add in other related benefits and payroll taxes to compute total costs and final labor rate
The last step consists of adding all the related payroll and benefits cost. In the example below we adding 7.65% for the employer’s matching Social Security and Medicare benefits and $10,200.00 for the estimated average healthcare benefit cost. This brings the total comp, plus benefits and payroll deductions for the average employee to $57,928.06 per year. In the last step, we divide this by the number of hours we expect each employee to be available for productive work–2,035 hours–to produce the new direct labor rate of $28.47/hour.
GET A FREE COPY OF THE EXCEL MANUFACTURING P&L TEMPLATE BECAUSE YOU NEED TO GET STARTED TODAY!
Step 4 – Computing labor variances using a direct labor rate
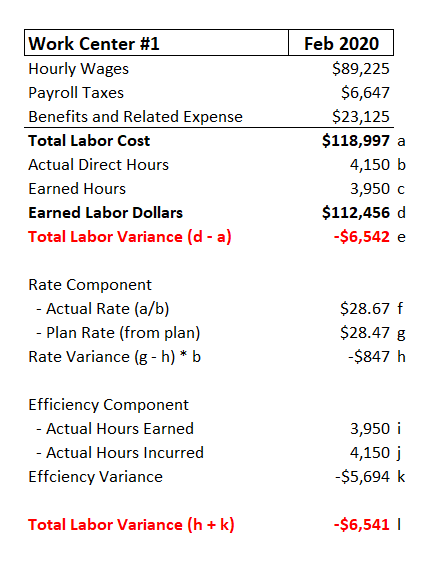
Now that you know how to compute direct labor rates, the next step is learning how to analyze monthly results. There are three components to computing a labor variance: 1) actual direct labor costs; 2) earned labor; and 3) earned hours. Earned labor is a function of earned hours and is just a product of multiplying earned hours by a direct labor rate. The example below is a hypothetical example of a company’s Work Center #1 results for February 2020. As you can see below, the hourly wages (straight time plus overtime), Payroll Taxes (FICA) and Benefits totaled $118,997 (a). The Actual Direct Hours, which would have been derived from looking timecards or a time clock, were 4,150. The production system reported 3,950 earned hours for this work center during February, which multiplied by the hour plan rate of $28.47, produces $112,456 (d) of Earned Labor. Immediately, comparing the actual direct labor cost of $118,997 vs. $112,456 you can see that we have an unfavorable labor variance of $6,542. So what produced the labor variance, rate/cost or efficiency?
GET A FREE COPY OF THE EXCEL MANUFACTURING P&L TEMPLATE BECAUSE YOU NEED TO GET STARTED TODAY!
The calculations for separating a labor variance into rate and efficiency is a fairly straight foward process, as you can see above. Note that adding the Rate and Efficiency variances equals the original variance at e). In this instance, we can see that the majority of the variance pertains to efficiency. Management can now take a deeper dive into the sources of the efficiency variance to determine where it pertains to incorrect labor standards, or not enough available production work or some delays due to part avaiability or whatever. This with the intent to improve efficiency in the near future.
Now That You Took the Time to Learn How to Compute Direct Labor Rates for Costing…
Hope fully you found this enlightening and can utilize it in your own organizations. If you need help setting up standard costs, or inventory reduction processes, please give us call. We have the tools to help.

Other relevant posts: