Build Your Own Gross Margin Bridge Using Our Excel Workbook
5 Lessons | 15 Minutes of Video Instruction | 2 Excel Workbooks (1 With Macros/1 Without Macros)
Purchase Course $29.95 For 3-Months Access
How Purchasing Our Gross Margin Bridge Toolkit Will Help You
If you have made it this far, you likely already possess some understanding of the significance of bridging gross margin results to a plan or a prior period. This bridging process provides actionable insights into the profitability of current sales activities. Beyond the time savings you’ll experience by utilizing our gross margin bridge model, here are several key insights you’ll gain once the model is implemented:
- Is our pricing strategy aligning with the plans of the Marketing Department?
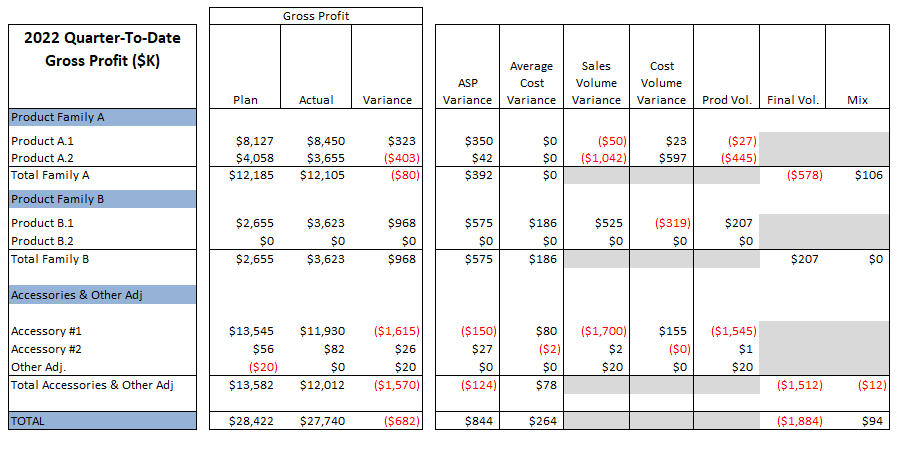
- What is the gross profit/margin impact of new products?
- How are volume differences within a product family/group affecting gross profit/margins?
- Are our assumptions regarding standard/average costs accurate?
- How much are volume, price, and mix factors contributing to either a positive or negative influence on total gross profit?
- Which specific products or product families are exerting the most significant impact on our bottom line?
- How does our current performance compare to our results from the previous year, and what actions are necessary to uphold our margin growth strategy?
There are worksheets for a product-level annual plan, monthly results and the margin bridge analysis. The model is set up to enable summarizing your margin results by month, year to date, a give quarter, or whatever period you require. Additionally, we have included one workbook that includes a couple simple macros that are intended to illustrate how you might enable your report consumers to more readily print summary analyses.

Who Will Benefit From Utilizing This Model
Similar to much of our content, the gross margin bridge is designed for accountants, financial analysts, and astute business owners who possess experience in working with Excel formulas and worksheets. You will require access to both historical and current actual results at a product level, encompassing total revenue, units shipped, and cost of goods. This course aims to assist users in efficiently initiating their own gross margin bridge analysis reporting tool through a series of video training sessions. Furthermore, those who acquire this course are eligible for a complimentary 30-minute consulting session, which can address any inquiries you might have concerning your specific application.
Please feel free to reach out if you have any questions or if you would like to take advantage of our free 30-minute consulting support offer. You can do so by visiting our Contact Us page.
Purchase Course $29.95 For 3-Months Access