Tools You Can Use
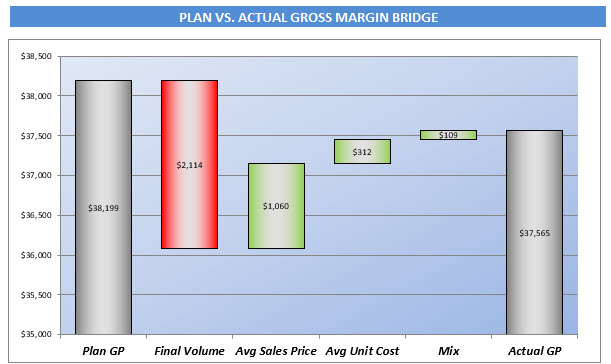
Gross Margin Bridge Using Our Excel Workbook
Picture this: You’re handed the challenge of dissecting gross margins, crafting strategies to amplify profitability. While you possess a basic grasp of the issue, time is of the essence for implementing a remedy. But guess what? The solution you’ve been hunting for is already within your reach.
Introducing our definitive Gross Margin Analysis tool – your shortcut to success. No need to devote a full day to replicating intricate formulas from our article. Instead, invest just an hour tailoring our dynamic template to your precise needs. With this time-saving treasure, you can dive right into boosting profitability today!
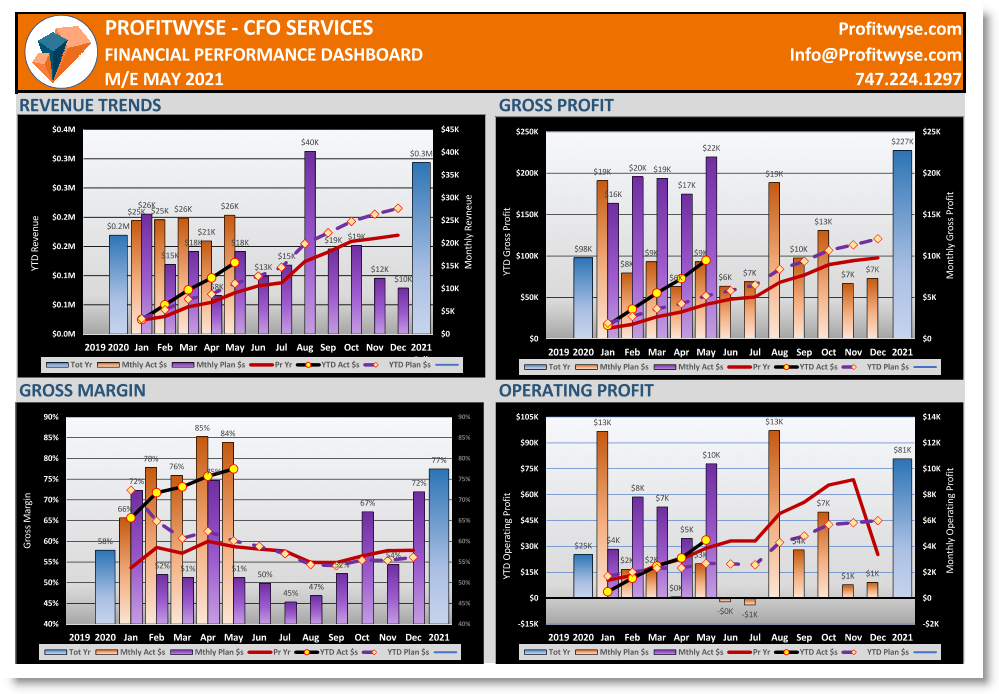
Build and Utilize a Financial Dashboard to Align Goals and Teams
Dashboards serve as proven management tools, playing a crucial role in fostering accountability and assisting business owners in attaining revenue growth, profitability, and enhanced cash flow.
We meticulously outline the step-by-step process for creating these invaluable financial results dashboards, utilizing the same approach that we successfully apply with our clients. Gain insight into the inner workings of our process as we meticulously dissect each stage of dashboard development.
Within the article, you will also have the opportunity to request a copy of the dashboard template for your own implementation.
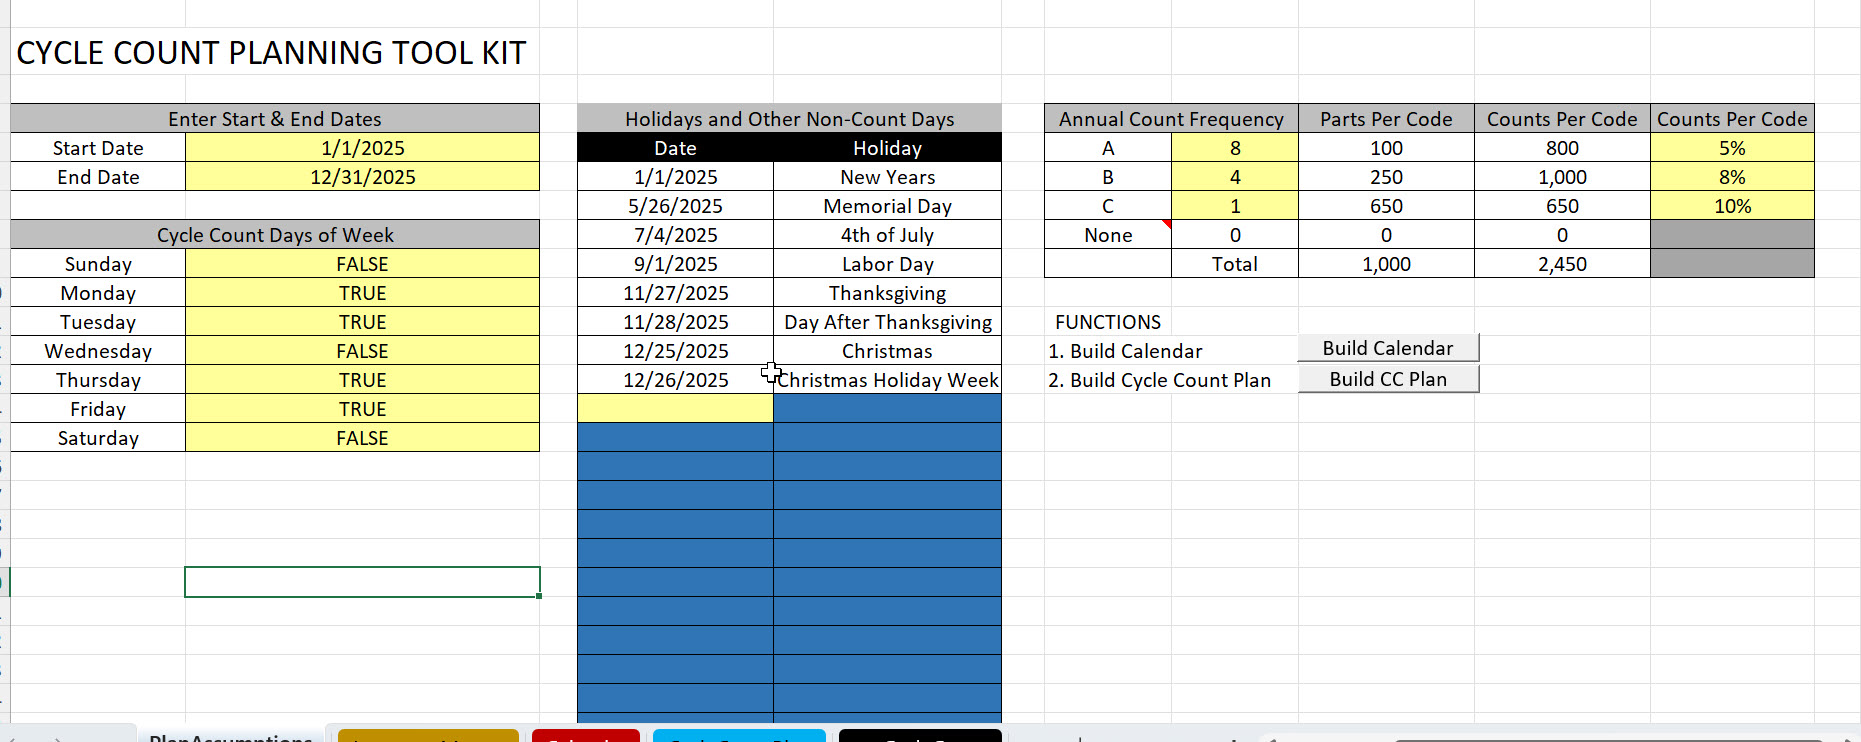
Cycle Count Planning Tool
If your ERP system does not plan out your Cycle Count program, as in determining when A parts, B parts and C parts as to be audited, based on your frequency choices (as in 8 times for As, etc.), then you need a copy of our Cycle Count Planning Tool. You can use this Excel workbook to layout a cycle counting program for all your inventory parts, keeping the daily count volume relatively consistent.
This is a macro-driven Excel workbook that you can customize to fit your requirements for count frequencies by category, e.g. A, B, & C, and modify the working calendar to adjust for what days you plan to count, as well as your holiday calendar. There is also an area to track your result, if that is something you required. Check it out, the tool is 100% free.