Exiting on Your Terms — Do Not Let Cost of Goods Sink Your Exit Strategy
So How is it that Cost of Goods Can Sink Your Exit Strategy?
A common concern that arises during due diligence that can impact your exit strategy, occurs when a business owner is attempting to close on the sale of their business, is period-to-period historical fluctuations in cost of goods. Though the focus in due diligence is on fluctuating gross margins, how businesses account for cost of goods is really the root cause of the fluctuations. Remember gross profit is computed by subtracting cost of goods from revenue or income. Potential buyers are seeking businesses with historical gross margins that are predictable over time and consistent with the acquisition’s industry cohort and with luck increasing. When we say do not let cost of goods sink your exit plan, what we really mean is do not let large gross margin fluctuations detrimentally impact your valuation. This is a brief discussion on the problem and some potential fixes.
Highly variable gross margins can be indicative of underlying business process and accounting issues that will potentially impact the acquirer’s confidence in the sellers. Problems of this sort will frequently result in price reductions or can kill the deal all together. The intent of this article is to help business owners better understand why buyers/investors are concerned with this issue and what can be done to ameliorate the problem before it sinks your exit plan.
What Exactly is Cost of Goods?
In a product-based business, cost of goods represents the capitalized cost of inventory that has transferred from the balance sheet to P&L. This primarily occurs as units of inventory are shipped to customers, but can also occur as scrap transactions or cycle counting adjustments.
In accounting terminology, inventory dollars are an unexpired cost, meaning the cost is idling on the balance sheet. Once an inventory item is sold or shipped, the related inventory dollars become an expired cost as title of inventory passes from the seller to a buyer. So I guess you could state that an expired cost indicates the benefit and risk of ownership associated with an inventory item has transferred from the business to a customer.
The inventory cost of an item includes at least one of the following costs: 1) direct material; 2) direct labor; 3) overhead expense; 4) subcontract costs; and 5) material overhead. A manufacturing business transforms raw materials and other costs into new items that have greater value the cost of the constituent parts. A distribution company generally does not add value to the inventory items purchased for resale. The cost of goods for a manufacturing company and distribution company is movement of inventory and inventory costs passing from the balance sheet to the profit and loss statement.
This concern can also affect service businesses, but that will be the focus of a future article. But again widely fluctuating cost of goods can sink you exit strategy even in service businesses.
Why Should I Be Concerned About Gross Margins?
Business owners contemplating the sale of their businesses need to be aware of the perception buyers will have when reviewing historic gross margin trends, which again is really driven by cost of goods, that appear uncontrollable. Here are a couple of questions that I ask my clients to assess their business processes relating to inventory costing:
- How frequently do you review and update product costing? Product costs should be analyzed at least annually with significant changes occurring at year end. Try to avoid revaluing inventory standards during midyear unless the change is material.
- Can you describe what costing methodology is used to generate product costing? Are you using average costs, standard costs, FIFO or LIFO?
- What are your policies regarding obsolescent, expired and excess inventory? If you have a policy, what provisions have been set aside for this type of inventory?
- How do you handle production variances? Do you capitalize and amortize them over an inventory turn, or let variances flow to the P&L as incurred?
- Do you have a cycle counting policy? If you do, what have the cycle counting results been over the past year? Do you perform root cause analysis on significant variances?
I like to have my exit clients review the two graphs below. Both graphs produce essentially the same average gross margin over the 12 months. Then I ask my clients, if they had to choose between purchasing Company A or Company B, which would they select? This frequently is when the light goes on during our exit strategy sessions.
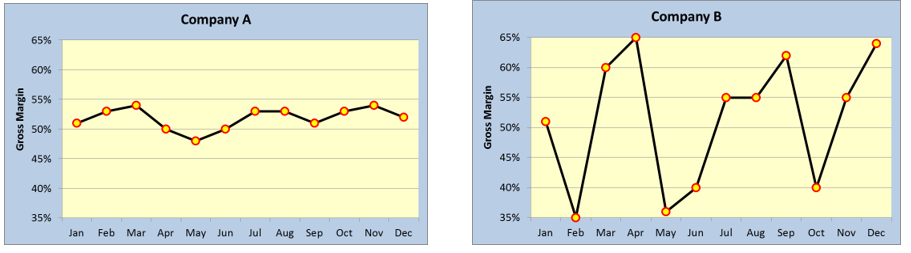
Invariably clients select Company A over Company B for obvious reasons when they see how cost of goods can sink your exit plan. Then we look at their gross margin trend and develop an action plan to fix the business processes that are creating variability in their cost of goods expense. If your gross margin trends look more like Company B than Company A, contact me today to learn how you can stabilize business performance and extract the company value you have worked so hard to build.
If you are a business owner that is looking for ways to improve the salability of your business, please contact us today .

Other relevant posts: