
How to Compute Overhead Rates For Standard Costing and Utilize Variances
Cost Accounting 101 – Overhead Rate Computation
This post on how to compute overhead rates and utilize variances is the third installment in our Cost Accounting 101 primer. The goal is to help you determine what should and should not be in your overhead rate/pool, what is required to set an overhead rate, and how that rate can be used to make better business decisions. Given the amount of manufacturing that has moved off shore in the past 20+ years (some of which will hopefully return one day), the cost accounting skills needed to support a domestic manufacturing concern are more difficult than ever to find; consequently, we are striving to perform some basic education around how cost accounting works, including how to compute overhead rates for standard costing, and how it can help businesses improve profitability, cash flow, and the like.
What costs belong in an Overhead Pool
Defining what costs should be part of an overhead pool, typically starts with a discussion about what items do not belong in an overhead pool. Most all SG&A items do not belong in an overhead pool, including Sales, Marketing, Distribution, Administration, R&D, and similar functions that are not directly related to manufacturing. The items that do belong in an overhead pool include Manufacturing Support, Quality, Manufacturing Engineering, Document Control and similar functions that support the production processes. Direct Labor, as in the labor associated with producing the product, is not part of the Overhead Pool. See our post How to Compute a Direct Labor Rate post for more details on establishing a Direct Labor pool, if you have not done so already.
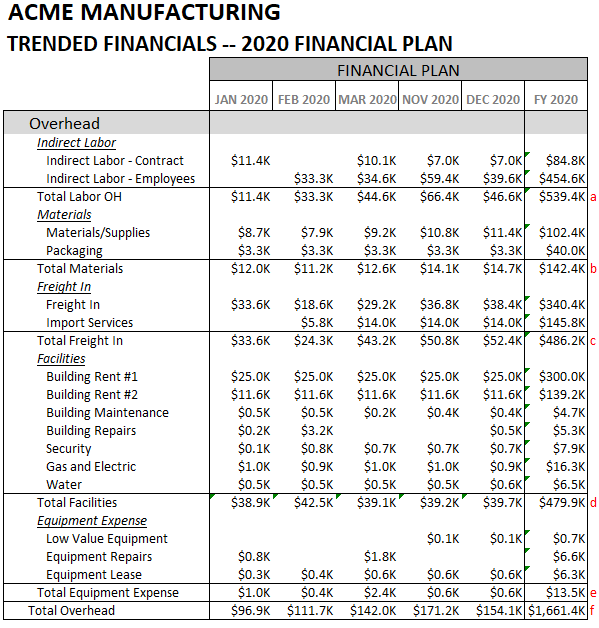
The majority of our clients are smaller concerns and really only have one department (or class if you are using QuickBooks), that constitutes the entire overhead pool. The first part of generating an overhead rate is developing a budget for the overhead pool. Shown below is an example of a client’s manufacturing overhead pool with several months hidden for display purposes:
GET A FREE COPY OF THE EXCEL MANUFACTURING P&L TEMPLATE BECAUSE YOU NEED TO GET STARTED TODAY!
From the above, you can see we have a monthly spending forecast, consisting of four account groups–1) Indirect Labor (in contrast to direct labor); 2) Materials (low value non inventory items and Packaging materials; 3) Freight In which is the cost of shipping material and products (not outbound materials. The total planned spend for 2020 is $1,661.4K at line f.
How to compute the overhead rate, absorption plan and planned absorption variance
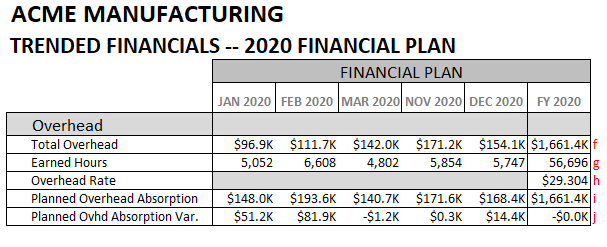
Computing the overhead rate, which is amount of overhead dollars to be absorbed into product costs in one hour, is fairly straightforward once you have computed your earned hours, because the overhead dollars will be absorbed when work orders are confirmed or closed. Most ERP systems will allow you to assign a cost account and department for the credit side of the absorption entry. Here’s is the summary of our overhead absorption plan which is based on the same earned hours projection made in How to Compute Earned Hours and Direct Headcount:
GET A FREE COPY OF THE EXCEL MANUFACTURING P&L TEMPLATE BECAUSE YOU NEED TO GET STARTED TODAY!
As you can see above, at row f, we have the total planned Overhead Spend plan by month, totaling $1,661.4K. Next, we bring in the monthly Earned Hours forecast that was computed in an earlier blog post, totaling 56,696 hours. Dividing the $1,661.4K in Overhead Spend by the planned earned hours gives us our hourly overhead absorption rate–$29.304/hour. Using our hourly rate, we multiply the monthly earned hour plan to compute the monthly planned overhead to be absorbed at line i. Finally, at row j you can see the planned absorption variance for 2020, with totals to $0.0k at year end. As you can probably surmise, there is not a precise correlation between monthly earned hours and monthly overhead spending. For example, in February we plan to spend $111.7K in overhead and generate 6,608 earned labor hours, producing $193.6K of absorption. So in February, we would say that we are over absorbed on overhead. But other months will offset with unfavorable variances, given that the entire year reconciles to $0.0K.
How to dissect a monthly overhead absorption variance
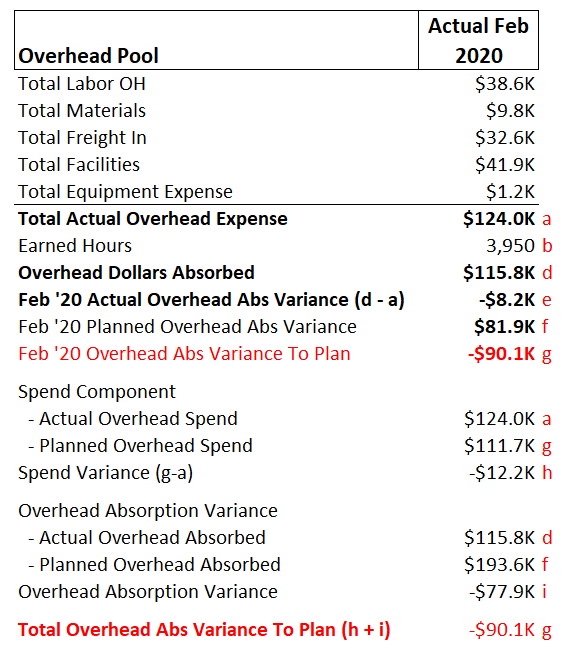
On a monthly basis you will want to analyze your overhead absorption variance vs. you plan to determine what portion is due to spending and what is due to absorption. Here is an example showing you the calculations for our hypothetical February 2020 close results:
GET A FREE COPY OF THE EXCEL MANUFACTURING P&L TEMPLATE BECAUSE YOU NEED TO GET STARTED TODAY
Looking at the above results, you can see that our fictitious company had $124.0K of spending, at row a, on the actual P&L in February 2020. Of the $124.0K spent, $115.8K was absorbed into inventory due to the 3,950 hours of earned labor generated by manufacturing. This produced $8.2K of unfavorable under absorbed factory overhead. Relative to the plan, we were expecting to $81.9K of favorable or over absorbed overhead in February. So what happened? You can easily split the planned absorption variance into a spend and an absorption component. To compute the spend component, we just subtract the actual spend, at row a, from the planned spend at row g (or from our plan that we referenced on the earlier post) to derive the spend variance, which was an unfavorable $12.2K.
To compute the absorption component, we just subtract the Actual Overhead Absorbed in February, at row d, from the Planned Overhead Absorption, at row f. The total absorption component of the spend variance was $77.9K. Looks like we planned for significantly more earned hours that was actually generated. Looks like the department manager for the overhead department is off the hook, but someone needs to speak with operations about why the earned hours were so much lower than planned.
Hope fully you found this enlightening and can utilize it in your own organizations. If you need help setting up your cost accounting processes, please give us call. If you would like a copy of any of the workbooks used as examples, feel free to reach out. We have the tools to help.

Other relevant posts: