
Where’s My Damn Widget? – 5 Steps to Improved Inventory Accuracy Using a Cycle Count Program
Do you have unexpected part shortages? Do struggle with inventory count accuracy? Are you performing full physical inventory counts during the year only to find things are inaccurate again the following week? Are parts frequently not in the location specified by your inventory management system? Let us provide you with 5 steps to improved inventory accuracy using cycle counting. Cycle counting is a fairly standard business practice used by distributors and manufacturers alike, to improve inventory accuracy and customer service levels, while also reducing total inventory costs which is typically a company’s biggest asset.
By implementing a robust cycle counting program, you can be assured of the following:
- Having a basis for establishing a inventory-related continuous improvement initiatives;
- Improved accountability within the warehouse team with respect to inventory accuracy;
- Improved confidence in the perpetual inventory balances, enabling the elimination of physical inventory counts;
- Enhanced insight into issues that are causing inventory inaccuracies and a reduction in lead time required to address those issues; and
- Most importantly, better customer service levels given the reduced probably of stock out situations caused by unanticipated part shortages.
The following 5 steps will get your cycle count program from a desire to fully implemented. Read on…
Step #1 – Determine the count frequency and proportion of inventory to be assigned to each count frequency code (aka ABC code)
Each one of your active inventory items will need to be assigned to either an A, B or C frequency code. The codes indicate the frequency with which each item will be counted yearly, as well as the importance each item represents within your inventory part number population (“A” highest importance, followed by “B” and then “C”). To determine the frequency and proportions for each code, you need to assemble a list of your active inventory items, along with the quantity shipped/consumed for each part of the past year. [Note: In this example, we are using the quantity shipped/consumed by part to determine each part’s relative importance to the organization. Use whatever method makes the most sense for your organization, such as a combination of quantities and extended inventory costs is another alternative.]
To illustrate how this should work, assume we can allocate 1 full-time person to the cycle count program, providing for 2,080 hours per year (40 hours week * 52 weeks = 2,080 hours–sorry no PTO for our poor cycle count analysis). After conducting a simple engineering time study, we observed that the average cycle count required 10 minutes, which provides for 12,480 counts per year (sorry, but no breaks either). This includes both the initial count and any post reconciliation/investigation required.
Now that the number of theoretical part counts have been estimated, we can return to our list of active inventory items, with the quantities shipped/consumed over the last 12 months. From our list, we see that we have 5,000 active inventory part numbers. We have also retrieved the quantities shipped/consumed and sorted our list in ascending order by volume.
In our example, we determined that about 10% of our inventory items are extremely critical because of extended lead times and interchangeably between various products; consequently we have decided that we want those parts counted 8 times per year. Next, the second tier products are the next 25% of inventory items, with the remainder 60% being of lesser priority because there are multiple sources within close proximity to the plant. Given these parameters, we are very close to the maximum number of cycle counts our inventory analysis can perform:
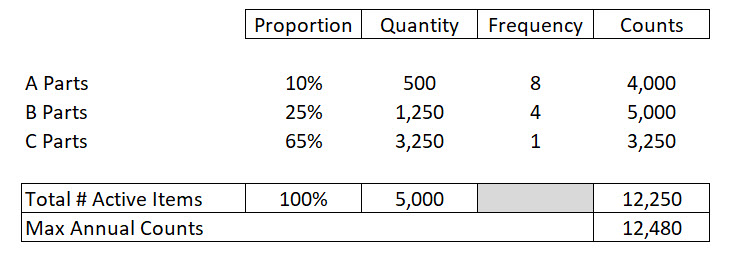
From the above, we can see that the current assumptions are within our maximum number of cycle counts. If we were higher or lower than plan, we could adjust the parameters (mostly Proportion and Frequency to fit better fit our unique circumstances). Step #1 is complete, we have the key assumptions needed to add more details to our plan.
Step #2 – Assign Our Inventory Parts to Our Planned Working Days Throughout the Year
Next, you need to slot the 12,250 counts into the calendar. With our full calendar, that has no assumed days off (not even Christmas??), we can perform 47 counts per day (12,250 / (52 weeks * 5 days/week)). At 10 minutes per count, 47 counts would require a little under 8 hours (47 counts * 10 minutes/ 60 minutes = 7.8 hours). This plan is a little unrealistic for nearly all businesses, but you will have to adjust the assumptions to fit your unique circumstances.
There are many ways to slot the counts into the calendar, most of them involve a bit of brute force machinations, but we have create a Cycle Count Tool Kit, that if your ERP system would build the plan, this Excel workbook will. See the video below for more information:
Get more information and/or request your copy of the Cycle Count Plan tool.
Step #3 – Execute on the Plan and Root Cause Variances That Exceed Established Thresholds
Once you have established a plan, then you need to determine how you will execute on your plan. There is some common vernacular around the cycle counting processing that includes the following:
- Perpetual Count: This is the quantity that is referenced in your ERP system and is being updated automatically through receipts, work order consumption, shipments, scrapping, etc. type transactions;
- Physical Count: This is the actual count determined by physically counting or measuring the quantity of inventory on hand at a specific location;
- Book-to-Physical Adjustment: This is an inventory transaction whereby the current perpetual inventory balance is adjusted to the physical count, with the variance being posted to the P&L as either a debit (for missing inventory) or credit (finding more inventory);
- Unreconciled Count: This is the initial count made by the warehouse team and returned to whomever analyzes the cycle count results. Generally, step 1 is give a part number and location to the warehouse person responsible for counting the inventory, without the expected result (or perpetual balance in your ERP system) and then compare the result to the perpetual system;
- Variance Threshold: If the threshold is exceeded, this is used to determine when your warehouse personnel need to return to the part and location to repeat the physical count;
- Reconciled Count: If the part count exceeded the threshold, and the second count confirmed the physical quantity was different than the perpetual balance, then the reconciled count is posted to the perpetual system to update the count using the book-to-physical adjustment process; and
- Root Cause Analysis: When parts exceed the variance threshold after repeated efforts to reconcile the difference between the perpetual and physical counts, then the inventory analysis team needs to determine what caused the variance and associate the event with one of your predetermined root cause types (see below for example).
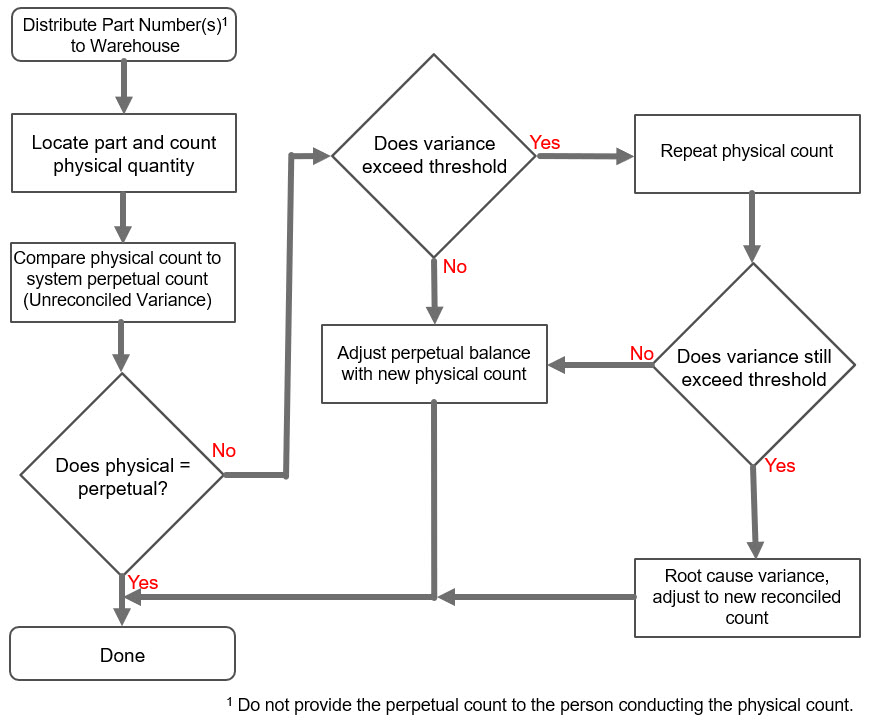
You will need to establish a process for cycle counting that includes repeat counts for parts that exceed your threshold variance amount. Here is a flow chart for the typical cycle count process that you can modify for your own process workflow:
When counts exceed threshold variance, you will want to root cause the variance to provide a feedback mechanism that the organization can use to monitor performance and take correction action, when required. Here is a typical list of root causes that fit the typical distribution company:
- Untimely reporting of invoices and/or receipts: Use this when
- Incorrect inventory location;
- Issue with inventory labeling
- Issue with Unit of Measure;
- Inventory Shrinkage; and
- Other (neither 1, 2, 3, 4, nor 5) Requires comment
Revise these 6 categories to suit your business requirements. But even before you do that you need to determine what you variance threshold will be. This is the quantity % variance that when exceeded, mandates that the Warehouse team go back and perform the inventory account a second time. When variances are below the threshold, the Warehouse team should just adjust the perpetual count to align with the new physical count and move on.
Step #4 – Track Results and Take Action on Unfavorable Trends
Clearly, the most important aspect of having a robust cycle count program is increasing the accuracy of your inventory, such that it enhances customer service levels while allowing the business to reduce safety stock levels and other inventory write off expenses pertaining to excess and expiring inventory. In addition to having a more reliable inventory processes, your cycle count program can provide a number of valuable insights into what is working and what needs improvement in your inventory handling processes; consequently you are going to want to capture your cycle count results and look for potential trends that can be proactively remediated before becoming larger problems.
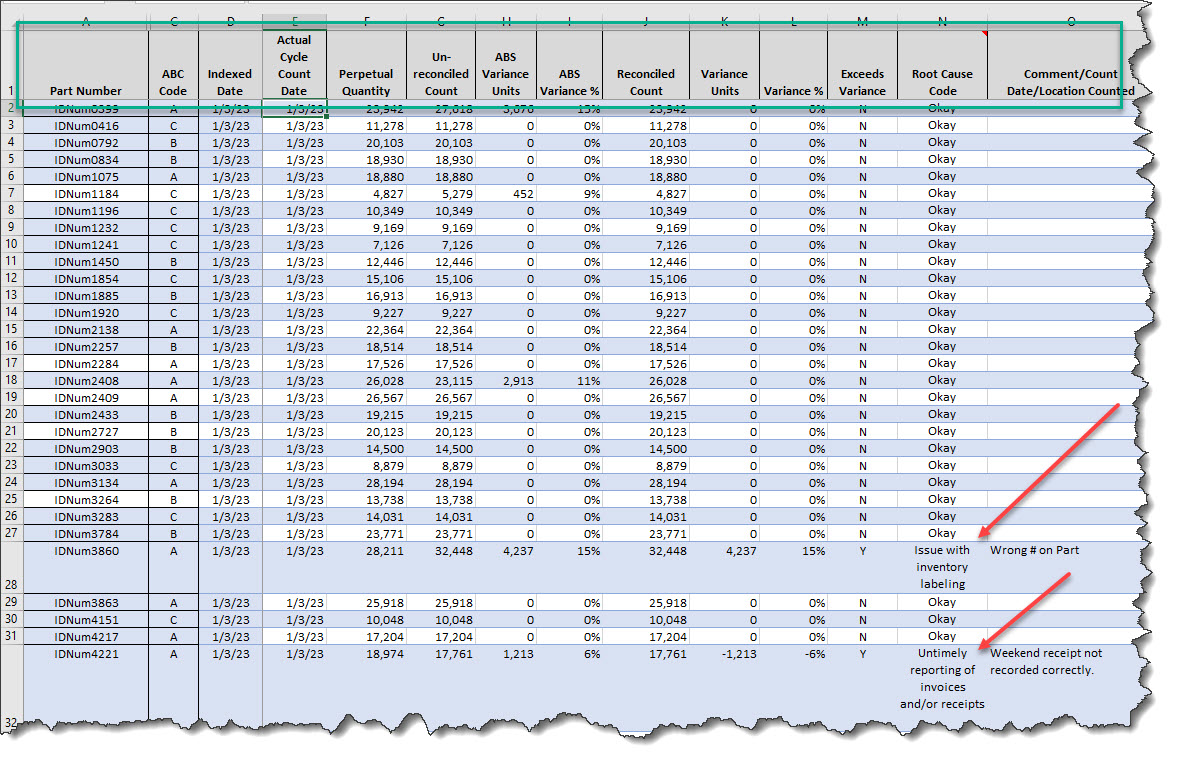
If you inventory management/ERP system does not support cycle count analytics, then you may want to start your own system for tracking results. Below you can see how we modified our original cycle count plan to include columns for recording and tracking cycle count performance. Here’s an example:
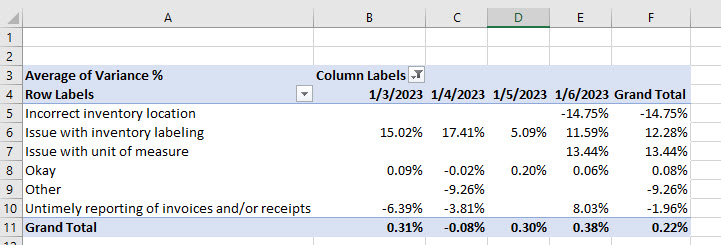
Subsequently, you can use either Excel Power Pivot or Power BI to generate trend analysis, such as in the example below, which only includes a couple of days worth of results, but still illustrates the concept.
Step #5 – Periodically Audit the Cycle Count Program Results
You will want to periodically have the Accounting team randomly select a few inventory part numbers and check the cycle count program by performing their own independent counts. Audit results need to be reported to both the CFO and Operations VP as an independent verification of the efficacy of your cycle count program.
Step #6 – What to do Next Once You Have Improved Inventory Accuracy Using Cycle Counting: Focus on Optimizing Inventory Levels
Do you know what your industry inventory turnover ratios are? Do you know how rapidly you are turning over your own inventory? Do you know how to compute Days Inventory On Hand for your total inventory as well as individual parts? If you answer no to one or more of the above questions, you need to get a better grasp on your company’s inventory efficiency and how it relates to your industry. Bench marking your inventory against your peers is a good start, but just that is just the beginning if you want to get to best in class level efficiencies. Read our post on how to improve inventory turnover ratio using DIOH to being your optimization efforts.
If you would like a copy of a draft cycle count procedure, reach out to and we will send along a Word document that you can modify as needed.
If you need any other assistance, we are available for consulting at reasonable rates. Contact us with any questions. Or…