How to Compute Days Sales Outstanding or More Commonly “DSO” and Improve Cash Flow
Why is Knowing How to Compute Days Sales Outstanding Important to my Business?
Days Sales Outstanding (DSO) is an efficiency metric for determining how quickly a business is able to convert a receivable into cash. Sometimes it is referred to as Days Sales Receivables or DSR. In either case, it is the same business metric. In this article, we will refer to the metric as Days Sales Receivables
Since cash is king, the faster a business is able to convert a receivable into cash, the better. Essentially, a receivable is created when a business extends credit to a customer. Some businesses do not need to extend credit at all, and consequently have $0 receivables. For example, McDonalds does not extend credit when you purchase a cheese burger. You give them the cash and you get your cheese burger. If you were to look at McDonalds SEC filings and review the level of receivables on their publicly listed balance sheet, you would see a very small number given their revenue size.
Most businesses have to extend credit to their customers. For example, if you sell products to retail stores as a wholesaler, then you are going to have to extend credit to your customers. If you were able to negotiate 30-day terms with all your customers and they precisely paid in 30 days, then your DSR would be 30 days. In reality, no business collects in precisely the number of days they negotiate with their customers and generally the resulting DSR is worse than what is negotiated for various reasons. But you want to pay particularly close attention to your business’ overall DSR performance to ensure it does not drift upward, or if does drift upward you understand the circumstances and have someone “bird dogging” customers for payment as well as enforcing credit holds when merited. As a CFO Services firm to midsize businesses, we frequently see business owners ignoring their overall DSR trends until they have a significant liquidity problem that could have been prevented by more diligently monitoring their metrics.
How to Compute “Days Sales Outstanding”
DSR like most financial metrics is retrospective in that you have to use historical business activity to compute the current month metric. There are basically two methods: 1) the look back method; and 2) the rolling 12-month method. I made up the name of the second method, because I am not sure if it has an actual name, but it is the more commonly used. This is because it is much easier to implement the rolling 12-month method in a spread sheet vs. the look back method. We will start with the look back method.
Computing DSR Using the Look Back Method
In either methodology, you start with the month-ending accounts receivable balance for a business. Though both methods given fairly similar results, the look back method is more well suited for monitoring DSR at a more granular level. For example, you would probably want to use the look back method if you were a construction firm and needed to understand DSR at a customer level. In summary, you start with the month-end receivable balance and you begin subtracting the monthly sales from the outstanding receivables balance, adding the calendar days from each month, until you go back far enough to bring the balance to $0. Typically you end up having to prorate the final month.
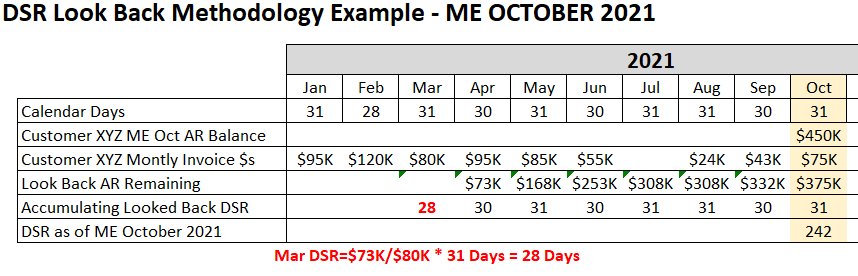
The example above reflects a single customer (Customer XYZ), with a month-end October receivable balance totaling $450K. On the next row you can see the monthly invoicing to this customer. To compute the DSR, we work backwards beginning with October 2021, by subtracting the monthly invoicing from the month-end October receivable balance, accumulating the days in each month. Starting in October, with a $450K balance, we subtract the October 2021 invoicing (invoicing equates to monthly sales) and get a balance of $375K. We then subtract the $375K balance from the $43K September invoicing to get $332K. This goes on until we get to $0K remaining receivables which happens in March.
The invoicing in March is greater than the $73K remaining balance from April; consequently we do not add the full 31 calendars for March, but prorate the 31 days. The March days are prorated by dividing the remaining balance ($73K) by the total March invoicing ($80K) and multiplying that fraction by the number of calendar days in March (31) or $73K Remaining / $80K Total Mar Invoicing * 31 Days = 28 Prorate Days for March. Then we add the days for March through October and get 242 Days Sales Receivable. This is huge DSR and indicates that the business have 242 days worth of invoicing extended as credit to this customer or about (242 Days / 30 Days Per Month) 8 months of work.
As you can surmise, using the look back method is a little complicated. But it does provide accurate DSR metrics when looking at an individual customer or in situations where invoicing/revenue is lumpy throughout the year. To easily implement the look back methodology, you will need a custom function macro. Contact us if you would like a copy of the function macro to perform this calculation. If your revenue tends to be relatively consistent, then you want to use the rolling 12-month methodology.
Computing DSR Using the Rolling 12-Month Method
As mentioned earlier, the rolling 12-month method is much easier to implement in a spreadsheet application. The method works well for businesses that have fairly stable revenue, with multiple customers. Here is an example of the rolling 12-month method:
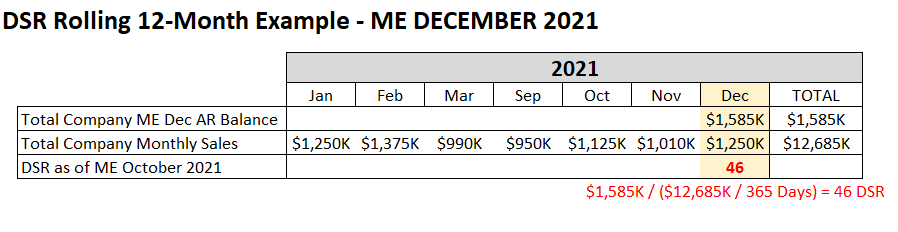
In this example, we have hidden the April through August columns for brevity. Here we are computing the DSR for ME December 2021. Since this is a 12-month rolling method, we accumulate the prior 12 months of sales, which was $12,685K. Then we need to compute the average daily sales, which is $12,685K / 365 Days = $34.75K per day. Now that we know what the average per day sales equates to, we just need to divide the month-end December receivables balance by this factor to determine that we have 46 days of receivables currently (or $1,585K / ($12,685K / 365 Days) = 46 DSR).
The following month, we would divide the January 2022 month-end receivable balance by the 12-month average daily sales, which would include sales for February 2021 through January 2022, and so on and so forth.
Gaining Actionable Intelligence Regarding DSR
The first step is gaining actionable intelligence is to put together a time phased financial plan that includes a forecast for both revenue and receivables. The starting point for this exercise would start with computing the DSR trends for the previous year to gain a good understanding of collection effectiveness. Using the prior year trend as a baseline, you can develop a generalized plan as to the DSR target. With the DSR target in hand as well as the revenue projection, you can back into the receivables plan.
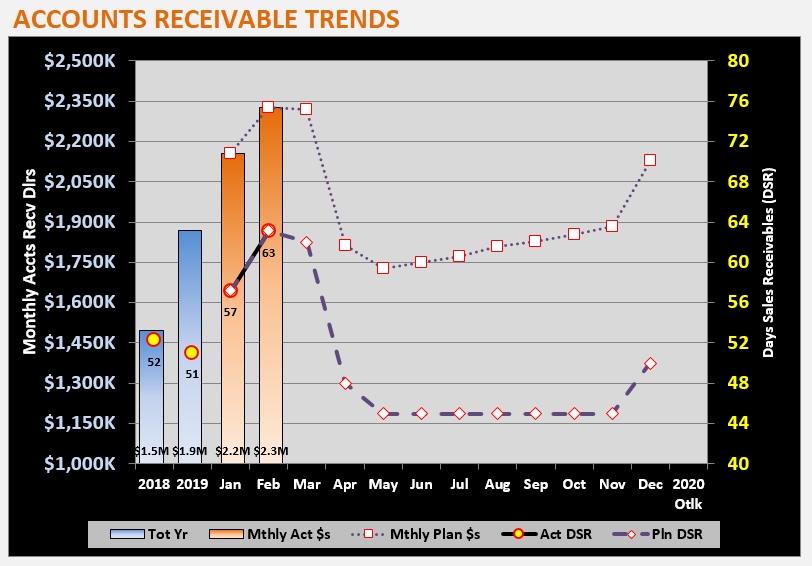
This is a good template for tracking receivables. You can see that on the left Y axis we are measuring monthly dollars of receivables. On the right Y axis we are measuring the DSR. The 2018 and 2019 year-end total receivables and DSR values are posted for reference. The 2018 ending DSR was 52 (see the yellow dot with the 52 below it) and 2019 ending was 51 days. The total receivables dollars increased from 2018 to 2019, from $1.5M (see the bottom of the column) in 2018 to $1.9M in 2019, while the net DSR decreased a day. This occurred because 2019 sales were 20% higher than in 2018. This is a good example where you cannot just look at the total receivables to figure out how efficiently you are collecting receivables.
You can also see that sales have been strong in 1Q 2020 and collections through February have deteriorated to 63 days of receivables on the balance sheet. Now is a good time to take a deeper dive into collections to better understand what is driving this increase to make sure there are no major issues. Using a tool similar to the above display helps business owners know when to dig into the detail and when to just tweak business processes, such as the number of days of credit extended to new customers, to affect cash flow.
Benchmarking and It’s Relevance to Managing DSR
Benchmarking is essentially the process of comparing a company’s financial metrics against an industry cohort of similar size. There are a number of places to get industry cohort metrics, one of which is the Almanac of Business and Industrial Financial Ratios, written by Leo Troy, Ph.D. and published by CCH.
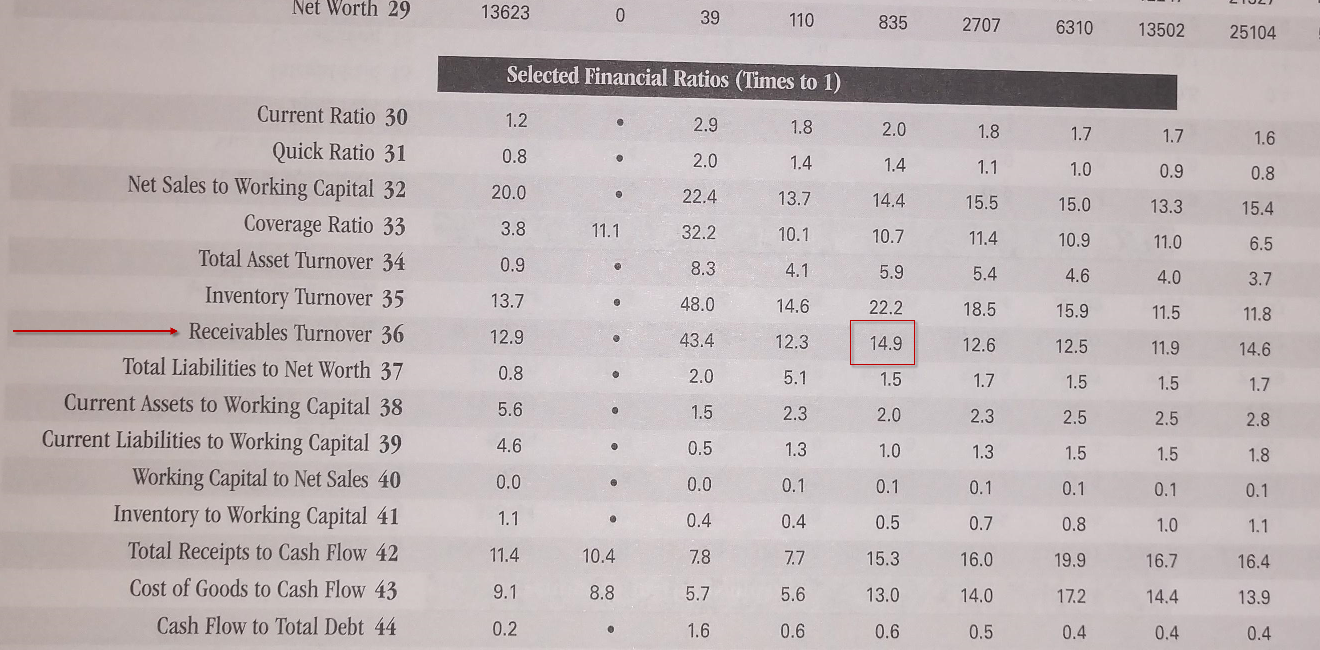
We have posted a copy of the page that relates to the this business below. The columns relate to the asset level with the industry group. For our company referenced above, the Receivables Turnover metric was 14.9x. To convert the Turnover to DSR we have to divide the number of days by the Turnover 365 Days / 14.9x = 24 Days. Given that our business DSR is in the low 50 days, this would indicate that other businesses within this industry are doing much better.
The 24 Day DSR more than likely requires more research. The cohort businesses may have a greater level of cash sales than our example company. But if our example company were able to achieve a DSR at 24 days, the Receivables would be cut in half increasing cash flow about $1.2M. Benchmarking is helpful, but the key is continuous improvement. The business ended 2019 at 51 days, which is better than 2018. With resources, the business should attempt to bring the DSR closer to 45 days by implementing strategies with key customers.
Final Comments on Days Sales Receivables
Managing receivables effectively is a management imperative for all businesses that extend credit. Your ability to management this important asset will be the difference between a business owner being a prince or a pauper. Learn the basics. Set up metrics so that you can monitor monthly changes in efficiency, such as the graph displayed above, and ask probing questions when trends are going in the wrong direction. At least quarterly, go through the sub-ledger details with your accounting staff and identify actions for improving collections and write offs. If you need a copy of the look back method Excel function macro, please contact us.