6 Reasons to Dump QuickBooks for Fishbowl Manufacturing
Have you outgrown QuickBooks inventory management capabilities? Are you frustrated with the modest ERP capabilities built into QuickBooks inventory management solution? If you are, you are not alone. Typical frustrations include 1) cumbersome BOM and routing capability; 2) limited physical location structures for tracking inventory; 3) minimal reporting capability; 4) no automated reorder capability for purchase orders nor material orders; 5) limited ability to extract transactional data which that prevents leveraging data analytics; 6) no cycle counting tools; etc. Fret no more and dump QuickBooks for Fishbowl Manufacturing.
If you are satisfied with QuickBooks as a G/L solution (tracking expenses, invoicing, accounts payable, banking, etc.), but are frustrated with QuickBooks as an inventory management tool, then Fishbowl is your answer. Combining Fishbowl manufacturing and inventory management with QuickBooks is a cost effective way to implement more sophisticated business processes while increasing service levels and reducing total inventory. Here are 6 reasons to engage Profitwyse Fishbowl support to alleviate your frustrations with QuickBooks:
#1
Robust BOM and Routing Capability
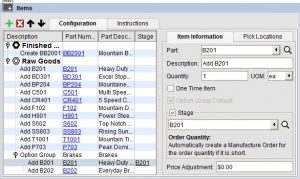
- Fishbowl will enable you to create more complex BOMs with routings, including subassembly or stages within a material order. Material orders can be modified on the fly when needed to deal with part substitutions. You can also create Kits. Lot and serial number tracking is standard to support food and other regulated industry applications.
#2
Increased Control and Options Over Inventory Locations
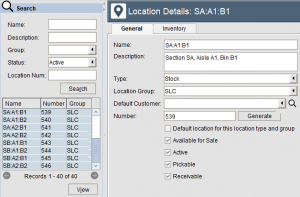
- Limited physical location structures for tracking inventory: Fishbowl utilizes a two-tier structure (Location Group & Location) to identify a specific location. Group is more akin to a building or area within a building. Locations are typically bins, shelfs, are specific areas within a Group. Designing how you structure Groups and Locations requires thought because it impacts how the reorder functionality automatically creates new material orders based on your reorder and order up to levels for each part. Also, there is an intransit location functionality for interplant transfers to help identify stock that maybe on a truck or ship or plane or train moving between plants. Here is an example of a Location screen with the various setting (Available for Sale, Pickable, Receivable, Active):
#3
Unlimited Reporting Capabilities
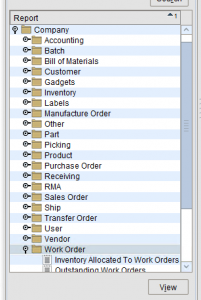
- Fishbowl comes with over 150 standard reports. Custom reports can be readily developed as required to fill unique requirements. Fishbowl operates on a MySQL database, enabling more complex reporting and data extraction methods. Here is an image of the current report groupings (you can see a couple of the Work Order reports displayed toward the bottom of the image):
#4
Automatically Generate Replenishment POs and Material Orders By Location
- Once you have established shipment history, you can have Fishbowl automatically compute your reorder points and order up to levels with the transaction history. In the absence of shipment history or as your standard business process you can manually update the reorder points and order up to levels on a part-by-part basis or you can import a list with part numbers and the new reorder points and order up to levels.
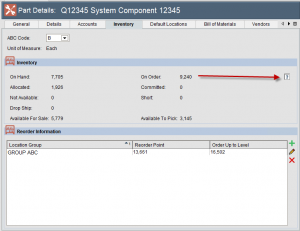
In the example below for Part ID Q12345, you can see the reorder point and order up to levels, 13,661 and 16,502 respectively, are associated with the GROUP ABC location group. If you have more than one location and needs to have different reorder points, you can set it up separately. Looking at the Part below, you can see that it is assigned to the “B” cycle count group, there are 7,705 units on hand, the 1,926 allocated are on open sales orders and there are 9,240 replacement units on order. You could select the “?” mark icon to the right of the On Order quantity to get a summary of the open purchase orders or material orders associated with this part. QuickBooks does not have this capability.
#5
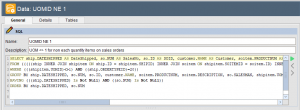
Utilize SQL Queries to Export and Transform Fishbowl Data
- Fishbowl allows you to create custom SQL queries to run against your database and produce custom datasets that can be exported to either CSV or Excel file format. This information can then be imported into an Excel spreadsheet, Access or SQL Server database for additional analysis. This is an example of a SQL query that pulls shipment history for all sales orders with unit quantities greater than 0. This is example of a query the pulls the inception to date shipment history for a set of sales orders:
#6
Leverage Fishbowl Data to Create Insightful Custom Excel Reports
- At Profitwyse, we focus on helping our clients leverage their transactional data to enable better decision making. This generally means setting up a dedicated Microsoft Access database as a data warehouse for Fishbowl transactional and master data, which facilitates faster and more robust offline reporting. With this approach, we can set up data cubes with transactional data that can be filtered by date, customer, product, product hierarchy, sales rep and the like. Measures include total sales dollars, total cost, average sales price, average standard cost, dollars per sales order, number of sales orders, units shipped, total gross profit, and gross margin percentage, that allow clients to slice and dice their transactional data to fit specific business requirements for marketing, sales, production, customer service, quality, finance and other functions.
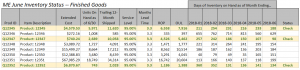
Here is an example of a custom report we created for a Fishbowl client that summarizes the inventory status for each finished good, providing the following information: 1) Part ID; 2) Part Description; 3) Extended Cost (units on hand times average cost per unit); 4) Units on Hand as of the report (6/30 in this example); 5) Trailing 12-Month Shipped (this would be how many units were shipped from July 1, 2017 through June 30, 2018); 6) Service Level (This is the client specified service level used to compute their safety stock which is combined into the Reorder Points. Reorder Points are basically demand over lead time plus safety stock.); 7) Months Lead Time (3.3 months equals about 100 days); 8) ROP is the reorder point amount; 9) OUL is the Order Up To Level; 10) 2018-01 is the Days of Inventory that were on hand for each product as of month-end January 2018, 2018-02 is the same number for February, and so on and so forth to 2018-06 for June 2018; and 11) a Status column that compares the month-end June units on hand to the reorder point (ROP) to give the buyer an indicator that they need to check to make sure that replenishment orders have been placed in Fishbowl.
Some of our Fishbowl data warehouse tables are sourced from Fishbowl standard reports. Typically, Fishbowl standard reports need to be transformed before the information can be easily exported to our data warehouse. Much of this transformation work is accomplished with simple Visual Basic code. In a blog post, we addressed creating CSV data from Fishbowl standard reports.
Profitwyse provides Los Angeles Fishbowl support to distributors and manufacturers as well as Ventura county based-businesses. If you are thinking about transitioning to Fishbowl and would like to get more from your current implementation, please contact us today for a free consultation. We will review your current business processes and develop solutions that will support your goals for revenue growth and inventory optimization.