
How to Convert a Fishbowl Inventory Download Into CSV Flat File
Fishbowl Inventory has over 150 standard reports that can be modified to produce very useful information. But frequently, even though you can export reports in Excel and/or CSV, the information is difficult to transform into a usable flat file. Though you can create SQL queries to export more complex data from Fishbowl, knowing how to covert a Fishbowl inventory download into CSV flat file, with a simplified approach using some Visual Basic (VBA) macros is extremely valuable.
This approach is especially useful because you can distribute simple macro-enabled Excel workbooks to inventory analysts and others within your company allowing them to generate Fishbowl CSV data on the fly.
First Step to Convert a Fishbowl Inventory Download to CSV Flat File – Start With Inventory Valuation Summary Report
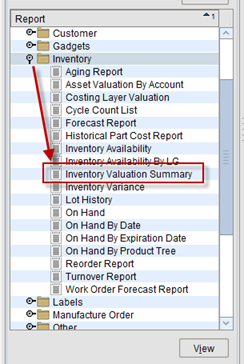
One example of this technique is with the Inventory Valuation Summary report, which you can find in the Reports module as shown below:
This very useful report includes a listing if inventory by Location Group (Location Group is the top level inventory location identifier, e.g. a warehouse, customer consignment location, etc.), by Location (Location is a subset of a Location Group), by Part Number. Then for each part you get the on-hand quantity, unit of measure, unit cost and extended cost (or Asset Value as the column is titled).
This report can be set up as a Scheduled Task to be generated and distributed on the frequency of your choice (options are Minute, Daily, Weekly, Monthly, Annually) or generated on demand. Generally, we set this report to run just before midnight on a daily basis. One the primary uses of this report is to reconcile total inventory asset value as detailed in a daily Fishbowl Inventory Valuation Summary report vs. what is reflected in QuickBooks. Frequently, this report is used to post an adjusting entry, when needed, to bring the QuickBooks inventory asset balance in alignment with Fishbowl’s representation.
When variances do arise, you can look at the daily inventory asset balance in QuickBooks and compare that to the daily Fishbowl Inventory Valuation Summary and root cause what transaction(s) are creating the variance. That’s a pro tip.
The Challenge With Using A Standard Report
At month end, we capture the values in this report to help with analyzing inventory efficiencies. But if you look at the report, it does not lend itself to being easily transformed into a flat file format with all the Location Group and Location information. Here is an example of a CSV export to Excel to better illustrate the challenge:
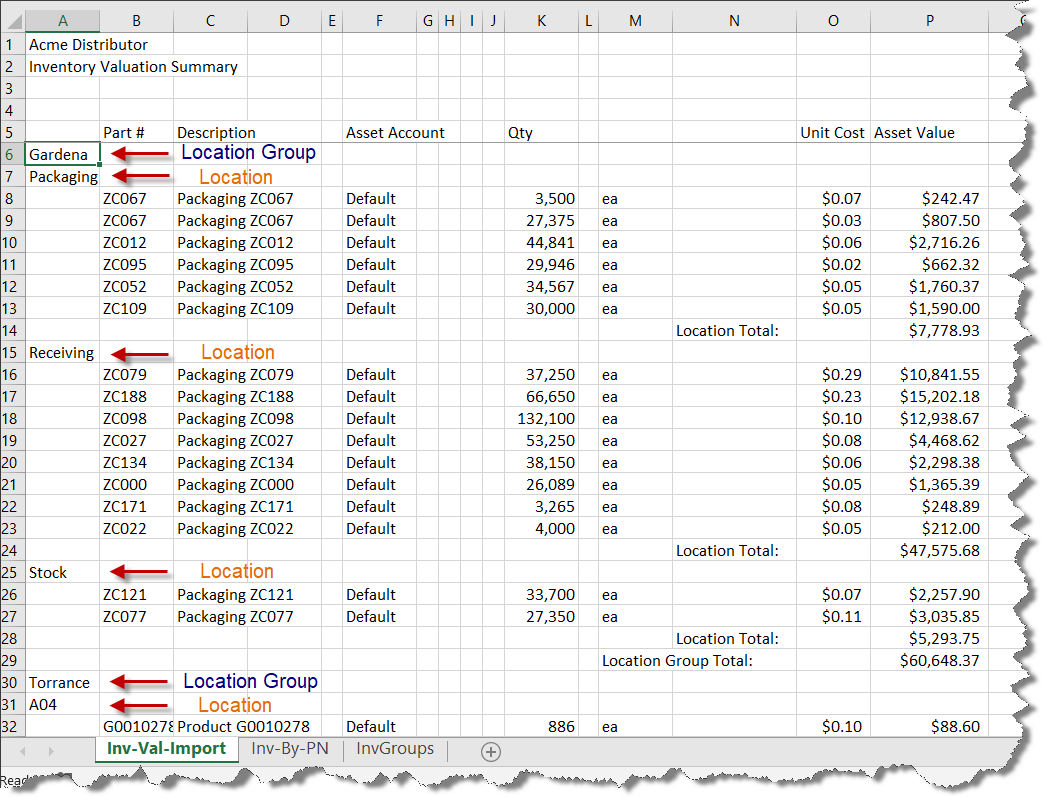
In the snippet above you can see that we have two Location Groups-Gardena and Torrance. Within the Gardena Location Group we have three locations-Packaging, Receiving and Stock. The Torrance Location Group has hundreds of Locations in this example. What we want is to have the data in the following flat file format to import into our data warehouse, by column:
- Location Group
- Location
- Part Number ID
- Part Description
- Quantity On Hand
- Unit of Measure (UOM)
- Unit Cost
- Extended Cost
If you look at the example above as compared to how we want the information summarized, you can begin to see the problem. For one, the Location is not on the same row as each Part Number. Next, you cannot easily distinguish Location Groups from Locations given that they are in the same column. If we only had one Location Group with a small number of Locations, we could easily parse this report just cutting and pasting by hand and get the desired result. But in this the example, the Fishbowl client had four Location Groups, 485 active Locations and 577 Part Numbers, totaling more than $2.5M of inventory value. The report itself was more than 1,900 rows in Excel. So you can see the challenge with converting this to a flat file.
Getting More Value From Standard Reports Using Visual Basic
As mentioned earlier, Fishbowl does provide us with the ability to run SQL queries on the live database and generate a very precise report. We use this approach to summarize shipment data, which cannot be gleaned easily from a standard report. But in this instance, since we had the report we decided to just create a VBA macro that would parse the Inventory Valuation Report and transform the data into the desired flat file format.
Our VBA app requires three worksheets:
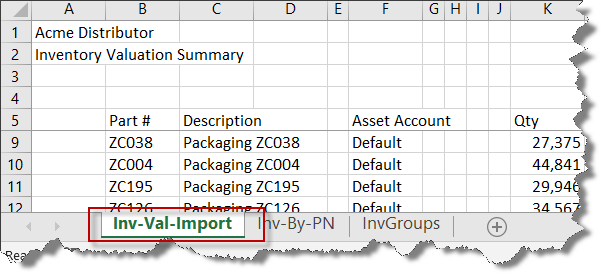
Inv-Val-Import: The entire Inventory Valuation Summary report is pasted onto this worksheet, beginning at cell A1.
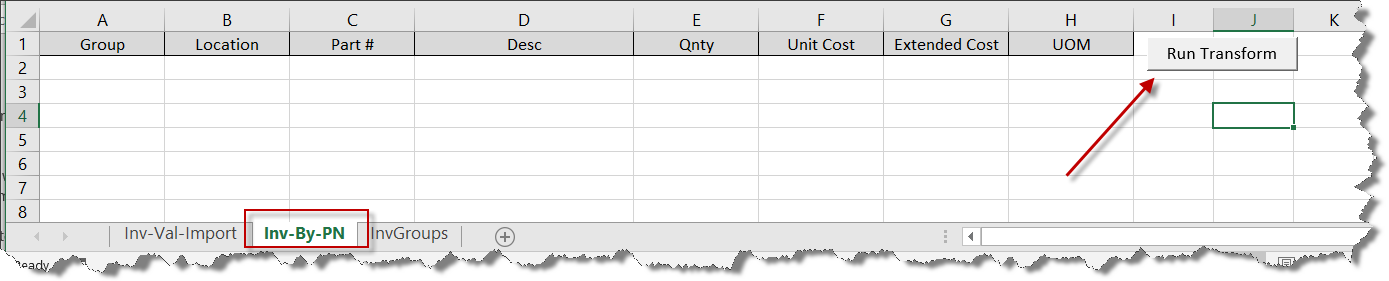
Inv-By-PN: This is where our flat file result will be saved. We wrote a macro that would be run when the user selected the Run Transform button at the right. Once selected, the macro will run down through the Inventory Valuation Summary report on the Inv-Val-Import worksheet and convert it row by row.
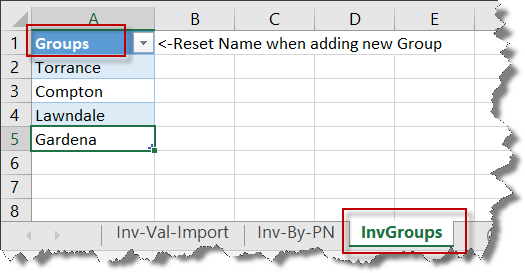
InvGroups: This page just referenced the Location Group names. The VBA macro runs through each cell in column A on the Inv-Val-Import worksheet. Each time the program finds something in a cell in column A, it checks it against the list on the InvGroups worksheet. If the item in column A is not on this list, then the item is a location. If it is on this list, the program resets the Location Group to the latest item on the list.
With the desired report pasted on the Inv-Val-Import page, we can navigate to the Inv-By-PN worksheet and select Transform. Here is the resulting flat file list (at least the first 24 rows):
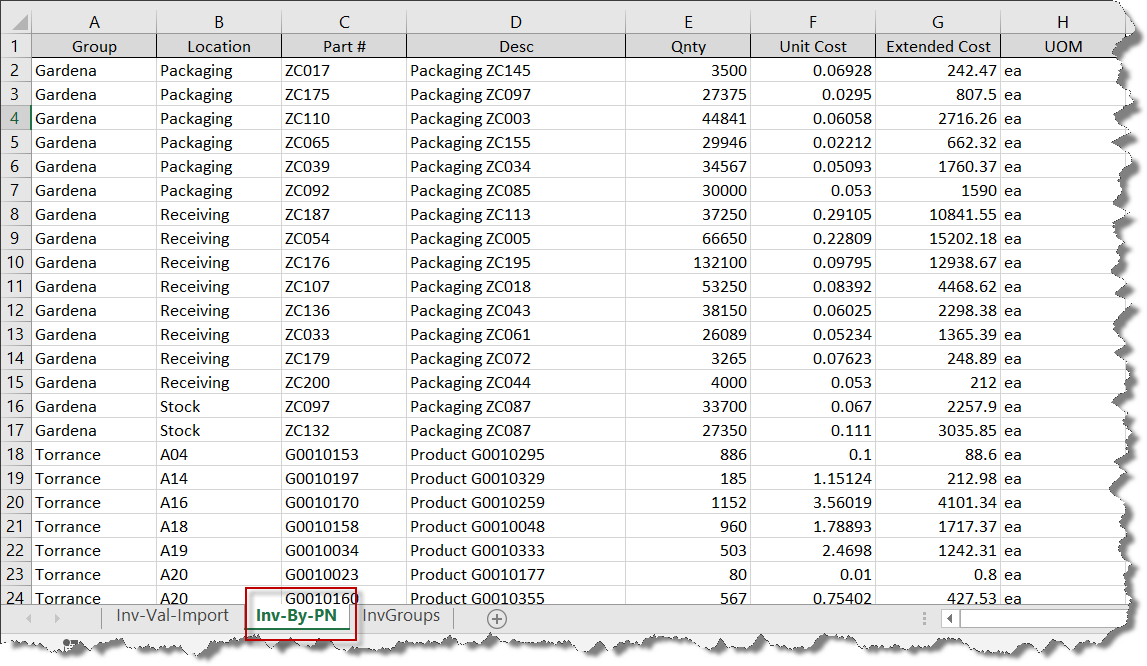
With our Inventory Valuation Summary report transformed into a more usable format, we can transfer this information to an Access table, Excel Power Pivot table or whatever to gain some new valuable insight.
Extending the Solution
A .txt file with the actual Visual Basic code for the above application can be viewed. Just copy and paste the code into a new Excel VBA module. We have extended this same technique to other standard Fishbowl reports, such as the Open Purchase Order Detail report, which will simplify listing of all open Purchase Order items by vendor when converting the actual report into a list report as well as the open Work Order report.
If you need help with how to create CSV data from Fishbowl standard reports and/or are interested in learning more, contact us today.