
Improve QuickBooks Inventory Accuracy By Adding Labor and Overhead Costs to BOMs
The Issue — Weak Cost Accounting Processes
Nearly without fail, when we engage with a new manufacturing client that is using QuickBooks to build finished goods and subassemblies, the business owner and accounting team are excluding the cost of direct labor and overhead from their BOMs which impacts QuickBooks inventory accuracy. The impact of not adding labor and overhead costs to QuickBooks BOMs is an understatement of the actual cost of inventory. This artificially increases gross margins, as well losing the ability to analyze labor and overhead efficiencies. Learn how to overcome weak cost accounting by adding labor and overhead costs to your QuickBooks BOMs which will improve profitability and generate actionable insight into your decision making process.
How to Create Fully Costed BOMs Using QuickBooks
First – Creating the Labor Absorption Factor
We are going to take you through a fairly simplistic manufacturing scenario, where the main product is bicycles, with just two varieties–Men’s Bicycle and Women’s Bicycle. Each bike consists of the 2 brake calipers, 2 brake levers, a frame, a crank, a front wheel, etc. Our manufacturing supervisor estimates that it takes, on average, one of troops 1.5 hours to assemble and test a completed bike.
The first step before we create the Inventory Assembly in QuickBooks, we need to create the Labor Absorption and Overhead Absorption factors that will be integrated into each assembly. In an early set of articles, we went into detail on how to generate direct labor and overhead rates, as well as how to analyze them during month-end accounting review.
The Labor Absorption factor represents the fully burdened direct labor cost, per hour, for an average direct labor employee. We wrote an earlier post on how to compute direct labor rates and determined that one hour of fully burdened direct labor equals $28.47.
To create the Labor Absorption factor, in QuickBooks navigate to Lists — Item List, and select New Item (Cntrl + N). Here is the detail set up for that Labor Absorption factor:
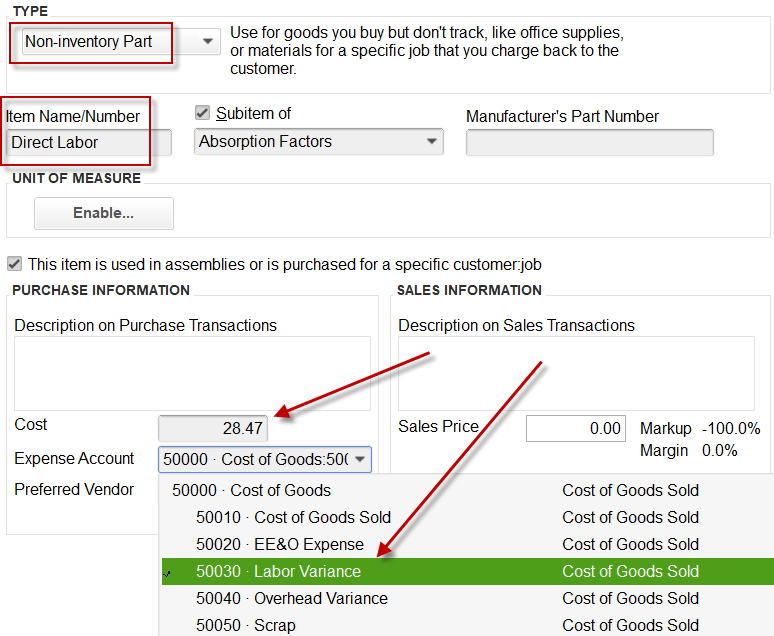
The keys here are selecting Non-Inventory Item, Cost at $28.47, and choosing a Labor Variance account in Cost of Goods, which will be the account that receives the Credit side of the Build Assembly process.
Second – Create the Overhead Absorption Factor
The Overhead Absorption factor will be used to absorb overhead costs into the QuickBooks inventory item. Similar to the other factor, we wrote an earlier blog post describing how to develop Overhead Absorption factors or rates and determined the per hour rate to be $29.30. Overhead will be absorbed as a function of direct labor absorption, in that when we capitalize one hour of direct labor, one hour of overhead absorption will be included as well. This process can be modified to absorb overhead based on machine time or whatever is the key metric driving manufacturing volume.
Using the same process as for the Direct Labor factor, here is the Overhead Absorption factor Item set up:
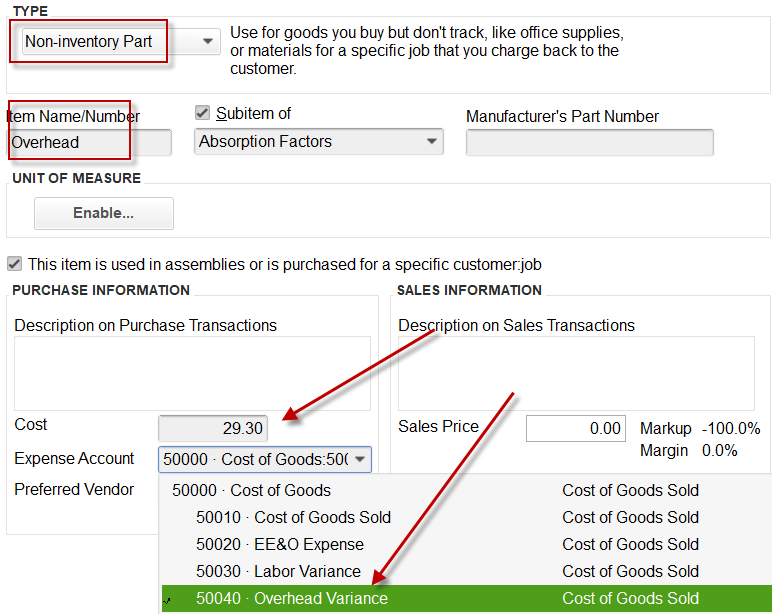
As you can see above, the only real difference other than the name of the Non-Inventory Items is the Cost and the Expense account, which in this instance was Overhead Variance.
Third – Add Labor and Overhead factors to Inventory Assemblies
As mentioned earlier, our example company assembles Men’s and Women’s bicycles. Referenced below is the Inventory Assembly for a Men’s Bicycle. Take a look toward the bottom, and you can where we added both Direct Labor and Overhead factors to our BOM.
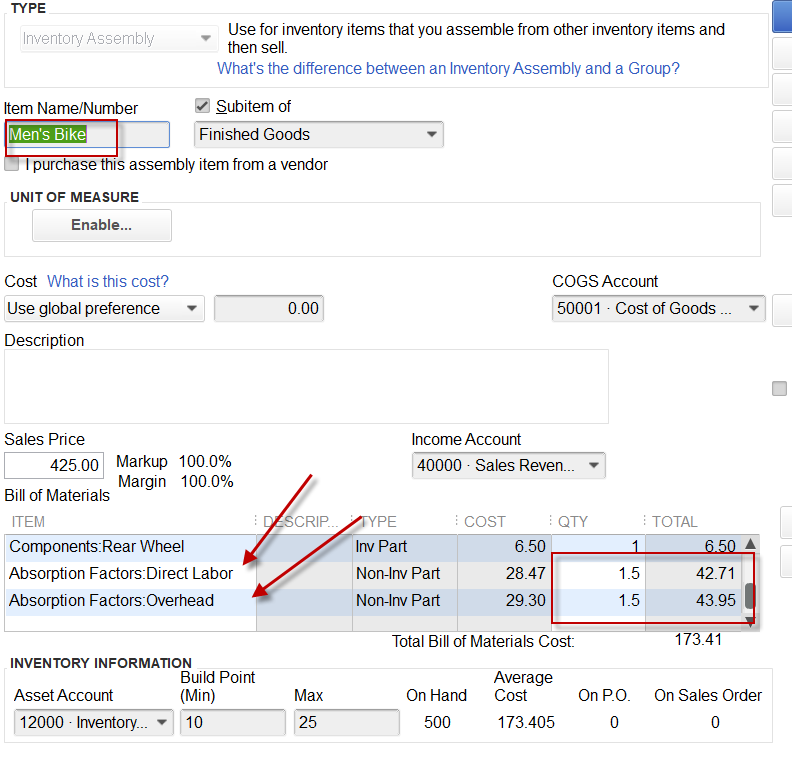
As you review the BOM above, you can see that we have the Direct Labor requirement to 1.5 hours of direct labor required to assemble one bicycle. From this, you can also see that each bicycle is going to absorb $42.71 in Direct Labor and $43.95 of Overhead, bringing the total cost per bicycle to $173.41 This means that there is $86.75 in direct materials, $42.71 in labor and $43.95 in overhead. As you can imagine in this case, if we were to exclude direct labor and overhead from our BOM, we increase the chance of making poor pricing decisions without the full picture. Also, this will allow us to account for certain models that require more or less labor to assemble in our pricing decisions.
How to Structure a Manufacturing Profit and Loss Statement in QuickBooks
Now you know understand the mechanics of adding labor and overhead costs to QuickBooks BOMs, we will now describe how to make sense of it. We probably should have started with this, but to enable your ability to segregate direct labor, overhead and G&A expenses, you will have to arrange your accounts and functional organizations accordingly. QuickBooks has two ways to accomplish this objective, which is through the Chart of Accounts or through Classes. Generally, we recommend to smaller clients, that have only a small number of functional department (e.g., a direct labor work center, a factory overhead department,a sales and marketing department, and finally an Admin department), to make the segregation using the chart of accounts without having to add the burden of assigning a class to each transactions In cases beyond that simple structure, using the Chart of Accounts becomes too burdensome and we resort to Classes.
Direct Labor Work Center Account Set Up
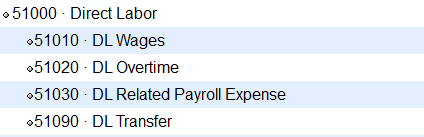
The only unique thing here is the 51090 DL Transfer account, which we will describe shortly.
Overhead Department Account Set Up
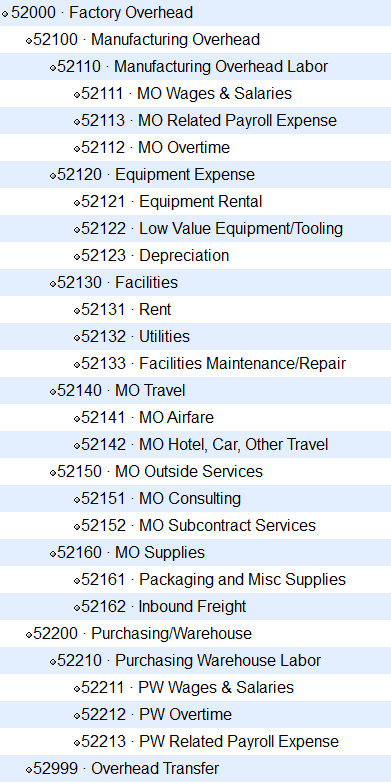
This should look fairly standard for an Overhead Department. We have decided that all the Facility costs will be absorbed into product costs. Above, you can see the issue with using the chart of accounts rather than classes to segregate the organizational functions. For example, we have preceded the Airfare account with “MO” for Manufacturing Overhead. If we were using Classes, there would only be an Airfare account. But we are trying to keep it simple given the size of the organization.
Other Cost of Goods Set Up
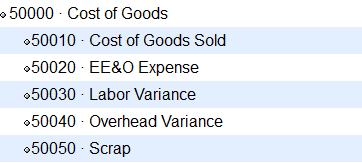
We already discussed the Labor and Overhead Variance accounts, which initially will reflect the monthly absorption. The 50010 Cost of Goods account is where QuickBooks is posts the cost of goods when product is shipped. The EE&O Expense and Scrap accounts are beyond the scope of this article.
Let’s Build Some Product
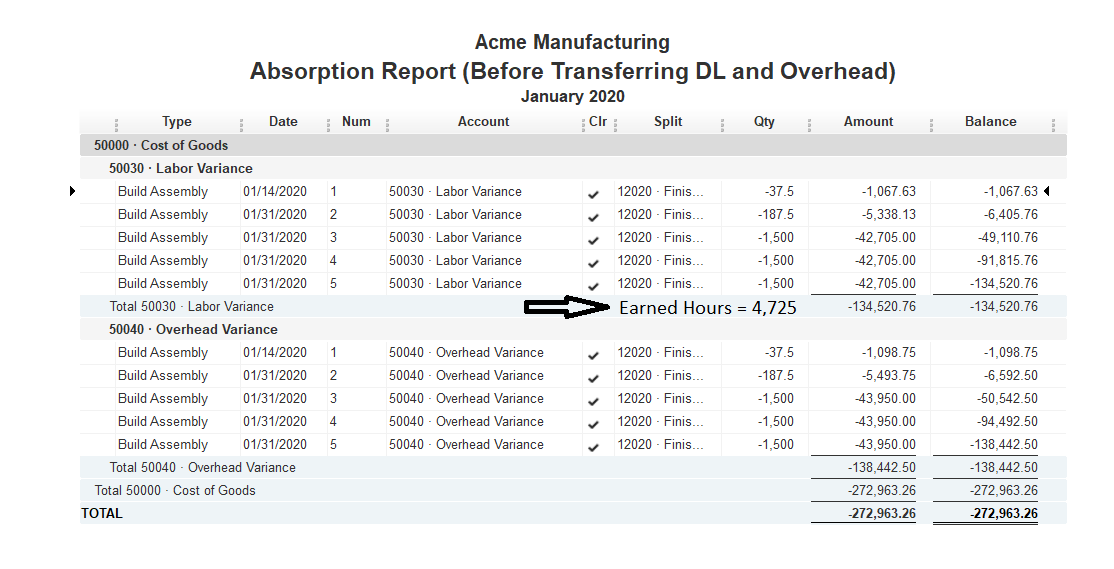
We created the custom report below to illustrate how our Labor and Overhead Absorption factors affect the P&L. We completed 5 different Build Assemblies or Work Orders, where we built 3,150 bicycles, generating 4,725 hours of earned labor. The 4,725 hours of earned labor equated to $134,521 earned labor cost and $138,443 of absorbed overhead.
The Month-End January P&L Before Closing Entries appears below. Take note of the “Total 50000 – Cost of Goods” summary, which as this point only includes the Direct Labor and Overhead absorption created when we completed the Build Assemblies, as well as the total Direct Labor–$151,819 and Overhead–$106,115.
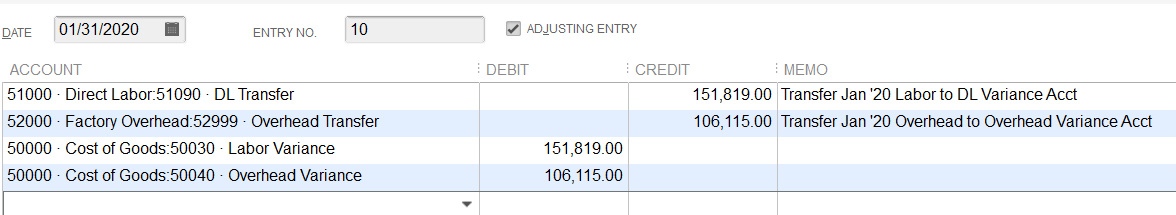
ME January Closing Cost Accounting Entry
With all the month-end January expenses post, we can post our final cost accounting entries, moving the Direct Labor to the Labor Variance account and the total Factory Overhead to the Overhead Variance account. This is the Journal Entry required:
Post-Close Cost Accounting Analysis
With the final cost accounting entries posted to the January P&L, we can begin the analyzing our results. This is how the post-close P&L now appears with the Direct Labor and Overhead transferred to the variance accounts:
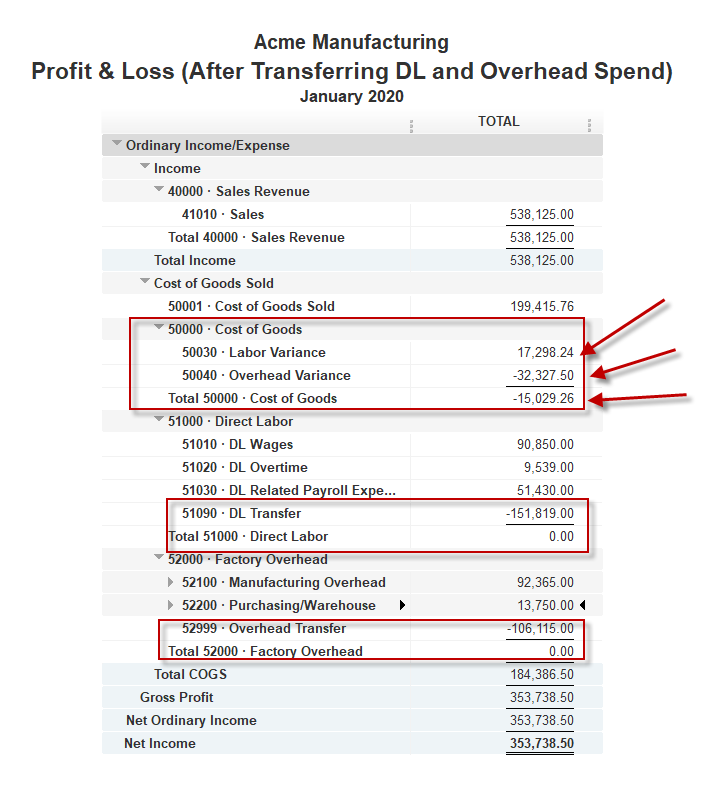
As you can see, the Direct Labor and Overhead departments total expense has transferred to the Labor and Overhead Variance accounts. The net is that operations produced $15K of total favorable variances, with an unfavorable $17K Labor Variance being more than offset by a $32K favorable overhead variance. The question now is should we be satisfied with that result or concerned. Digging a little deeper with help us better understand what is happening.
Direct Labor ME Results Analysis
The month-end January Direct Labor variance was an unfavorable $17K. Is that bad, good or nothing notable. Well we really need to compare what we planned the variance to be vs. what actually occurred. Let’s start with the payroll register and see what actually transpired to generate this variance:
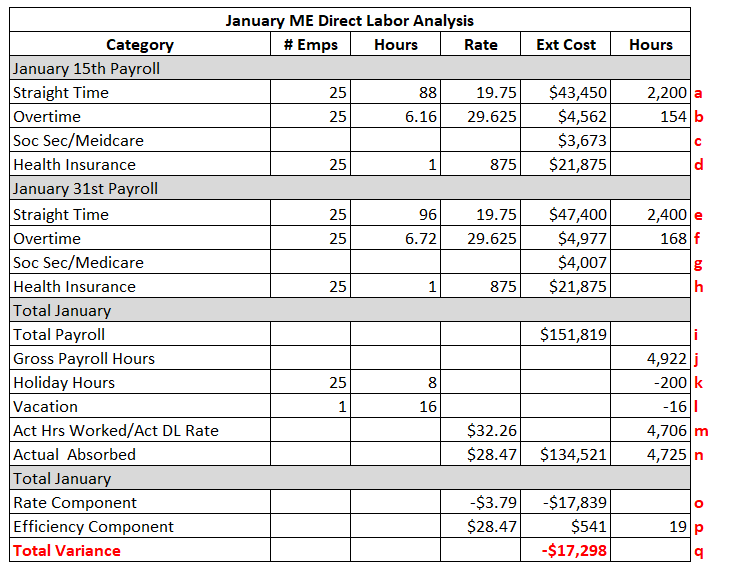
Reviewing the payroll register and summary analysis above, you will note that there were two payrolls in January and given the time no need for any ME payroll accrual. The total January payroll was $151K (i). We are going to adjust down the total payroll hours of 4,922 by the holiday and vacation hours (k+l), to derive the number of actual hours worked (or the number of hours that direct labor employees were available for productive work) totaling 4,706 hours. As you displayed earlier, the January earned hours were 4,725, which was computed by QuickBooks using our Labor Rate factor/Item.
To compute the Rate portion of the variance we need the actual rate, which is $32.26/hour ($151,819 Payroll $s / 4,706 Available Productive Hours). To get the variance, we compute the rate difference, which is an unfavorable $3.79/hour ($28.47 plan rate – $32.26 actual rate) times the number of earned hours (4,725) produces a $17,839 unfavorable rate variance.
To compute the Efficiency component, we need the difference in the number of Available Productive Hours (4,706) vs. the Earned Hours (4,725), which is slightly favorable, times the plan rate. This produces $541 of favorable labor efficiency.
Our analysis shows that we appear to have the labor standards set reasonably accurately at this point, but the labor rate variance is a concern. In this case we would want dig a little deeper to analyze if the issue pertains more to labor rates, the amount of vacation take vs. what we expected and/or the health insurance cost vs. what was expected. Once we better understand this final component of the labor variance we can determine if there is additional action.
Factory Overhead Variance Month-End Analysis
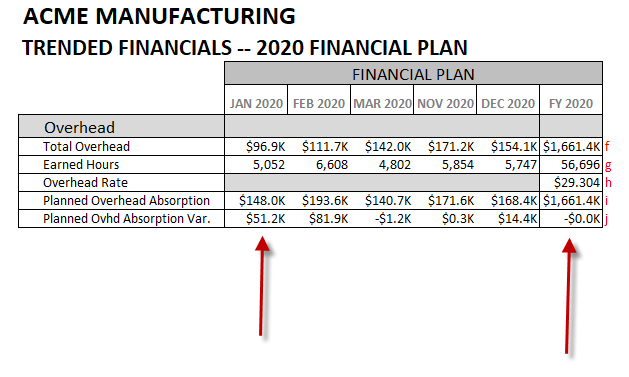
If you are not familiar with how to compute an overhead absorption rate when creating an annual financial plan, you may want to peruse our post on how to compute overhead rates and generate meaningful analysis, posted last year, to refresh your memory. For this example, we have used the same Factory Overhead projection used in the earlier post. You can see below that the January plan reflected spending $96.9K of expense, while absorbing $148K, on 5,052 projected earned hours, producing $51.4K of favorable factory overhead variance.
Below we elaborate on our comparison to plan. In actuality, the business spent $106K (a), against 4,725 earned hours (b), which meant that $138.5K (4,725 hours times $29.304/hour overhead rate) of overhead was absorbed into product costs. On the surface, we have favorable absorption of $32.3K. In comparison to the original plan where we were going to absorb $51.2K (f) of overhead, we are in reality $19.8K unfavorable to our 2020 plan. What happened and should we be concerned?
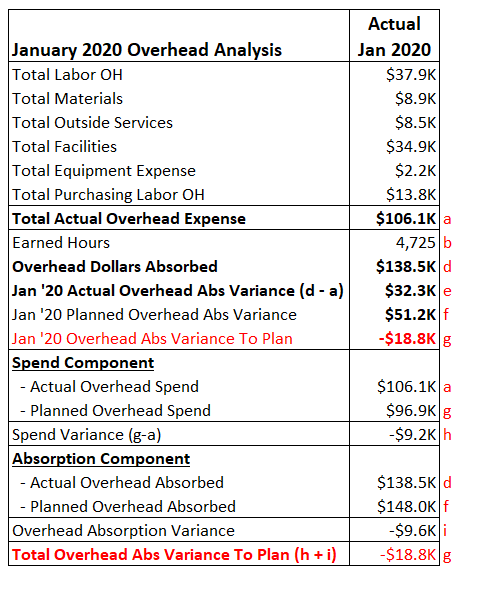
We really do have something to be concerned with given that we delivered fewer earned hours than planned, 4,725 actual vs. 5,052 planned. Also, we spent $106.1K in Factory Overhead when we planned to only spend $96.9K or nearly a 10% expense overrun. In the real world, this would require additional review between Operations Management and Finance on what are the primary drivers of increase spend and what is driving the shortfall in earned hours. With that information, we could then determine whether or not there were any corrective actions and generate an updated 2020 year-end projection.
Next Steps
We hope you have learned more about why adding labor and overhead costs to QuickBooks BOMs is so important. Having the ability to compare cost standards to actual results is an imperative for any manufacturing organization that is seeking to closely manage profitability and gain insight into business dynamics that influence success. With a few more months of actual results, a business owners and managers will deepen their understanding of the interaction between direct labor efficiency, material costs and overhead spending to an extent that they can then proactively influence profitability through cost improvement initiatives. This would include the identification and tracking of targeted cost reduction activities focused on improving profitability while also maintaining high quality standards. If you would like to learn more, please contact Profitwyse today.

Other relevant posts:
5 Steps to Improved Inventory Accuracy Using Cycle Counting
Use ROE to look under the hood and super charge your business
7 Steps to Improve Professional Service Firm Profitability
What is Building a Data Warehouse for Robust Analytics Requires a Versatile Accounting Calendar — Step #1
Average Costing vs. Standard Costing, Which is Right for my Business?