7 Steps to Improved Professional Service Firm Profitability
A continuous focus on improved professional service firm profitability should be an imperative for any professional services firm. In our experience, professional service businesses such as legal firms, IT companies and CPA firms seem to be completely oblivious to creating any processes or plans that would help them better assess their gross margin goal achievement. Though large companies perform this type of analysis, smaller professional service firms frequently have not seen this type of analysis and consequently don’t spend any time capturing the information. Here are 7 steps to improve professional service firm profitability, using a general model.
A Model for Improving Professional Service Firm Profitability
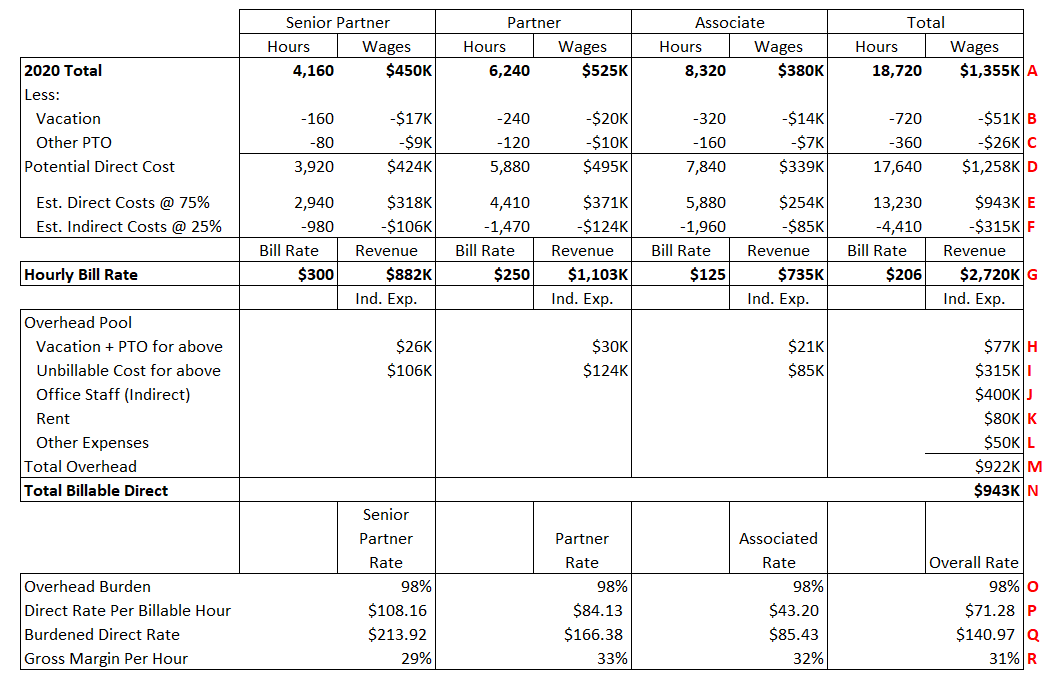
This is the labor and overhead rate plan for our hypothetical company:
Step #1 – Categorize Employees
Employees should be categorized by direct (revenue producing) and indirect (non-revenue producing support). Next, it is advisable to group direct employees by seniority/capability, such as Senior Partner , Partner and Associate. In this example, assume that we have two senior partners (2 @ $225K/year=$450K), three Partners (3 @ $175K/year=$525K), and four paralegals (4 @ $95K=$380K), bringing the gross wages for direct employees to $1,355K at row A. In addition to the direct employees, our business has three administrative personnel (aka indirect personnel because they do not bill their time directly to client jobs), including a bookkeeper, and the owner of the firm (the owner of the firm no longer bills out any hours; therefore, the owner is an indirect employee. Must be nice!).
Step #2 – Estimate Direct and Indirect Labor Cost/Hours
Direct time only applies to our 9 direct employees because most of their time will be billed to customers jobs. We have to assume that out of the typical 2,080-hour year, our employees will be absent from the office on vacation and/or need a couple of days for sick time. In addition to being absent from the office, some employee hours will be allocated for training and other company initiatives that are not billable to a customer job as well. This indirect time needs to be estimated and added to the overhead expense pool since it will be absorbed into total costs through an overhead/burden rate. With that background, Step #2 is to estimate the direct/indirect split of dollars and hours for our 9 employees. If you look at our model above, the vacation and PTO time estimates are at rows B and C, respectively.
From the previous summary, you will note that total payroll hours, both direct and indirect for the 9 employees, will be 18,720 with associated wages of $1,355K. Subtracting the estimated Vacation and other paid time off (PTO) estimates, you can see that our 9 employees are expected to be in the office 17,640 hours. Given our 75% billable hour assumption, we now have 13,230 hours planned to be billed to clients and another 4,410 hours going to indirect. In total, the direct labor cost will be $1,258K, with the remainder ($51K vacation, $26K PTO and $943K indirect) going to overhead
Step #3 – Develop Billing Rates and Total Revenue Projection by Employee Categories
The billing rates should be the expected average billing rate to be invoiced by the employee type. Then extend the billing rate against the expected billable hours (or direct hours) to derive total revenue for the year. Looking at just the Senior Partners, you can see that we have forecast 75% of available hours are going toward client contract work, which we termed as “Direct” in row E. The projected bill rate for Senior Partners is $300/hour times the 2,940 direct hours produces a forecast $882K of revenue at row G. Then we duplicate the same for Partners and Associates which totals direct hours of 13,230 and total company revenue of $2,720K for all three employee types, again at row G.
Step #4 – Compute the Overhead or Indirect Expense Pool
The overhead pool will consist of indirect labor (labor that cannot be identified to a specific contract or cost objective) and non-labor costs, including rent, office staff and Other expenses at rows H, I, J, K and L. The total overhead expense pool is forecast to be $922K at row M.
Step #5 – Compute the Overhead Burden Rate and Burdened Direct Rates
Now we just need to compute the overhead rate for the coming year. The rate is computed by dividing the total Overhead expense, at row M ($932K), by the direct labor total at N ($943K), which produces a 98% overhead rate. Next, we just need to apply the overhead burden to the direct hourly rate for each employee type and compute the planned gross margin rate as follows:
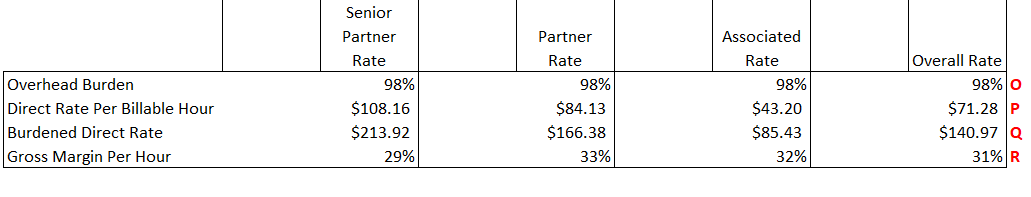
Viewing the Senior Partner details, you can see the hourly direct labor rate is $108.16/hour (total Senior Partner wages $450K / total hours 4,160 at row A). Then you apply the 98% overhead burden ($108.16 * (1 + 98%)) to get the fully burdened hourly cost for a Senior Partner. If we can the compute the gross margin for a Senior Partner (($300 bill rate – $213.92 burdened cost)/$300 bill rate), which is 29%. At this point, you should do some additional analysis to determine if 29% gross margin will generate the necessary gross profit. If 29% gross margin is not sufficient, you can do one of the following: 1) increase the bill rate assumption to something higher than $300/hour for Senior Partners and likewise for the other direct employee categories; 2) increase the direct labor assumption from 75% to something closer to 100%, within reason of course; and/or 3) reduce overhead costs.
Step #6 – Create a Time Phased Billing Plan
This is fairly simple because we are just going to straight line our plan (divide billable/direct/indirect hours by 12 as well as the expenses to generate the same revenue, operating expense and operating income per month.
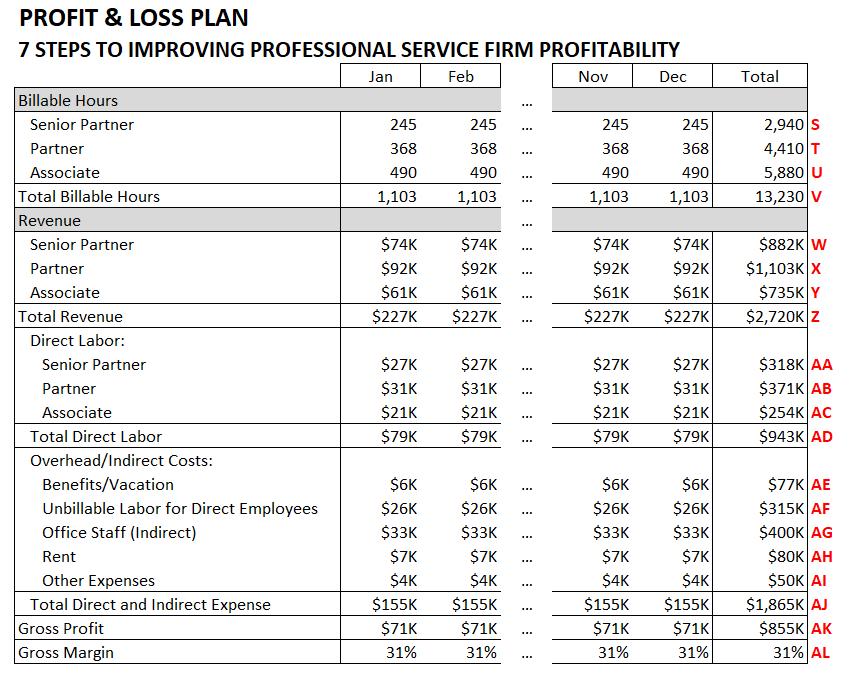
We have previously explained where most of these values are coming from; consequently not further explanation is needed.
Step #7 – Analyze Results and Take Action
With a detail plan in place, we can begin analyzing actual results vs. our plan to obtain actionable insight to enable our ability to improve professional service firm profitability. Though it is rather small, we have produced a plan vs. actual summary for the month of January. The analysis is split into the Support information at the top and a Profit and Loss Statement below. Here is the summary analysis for January:
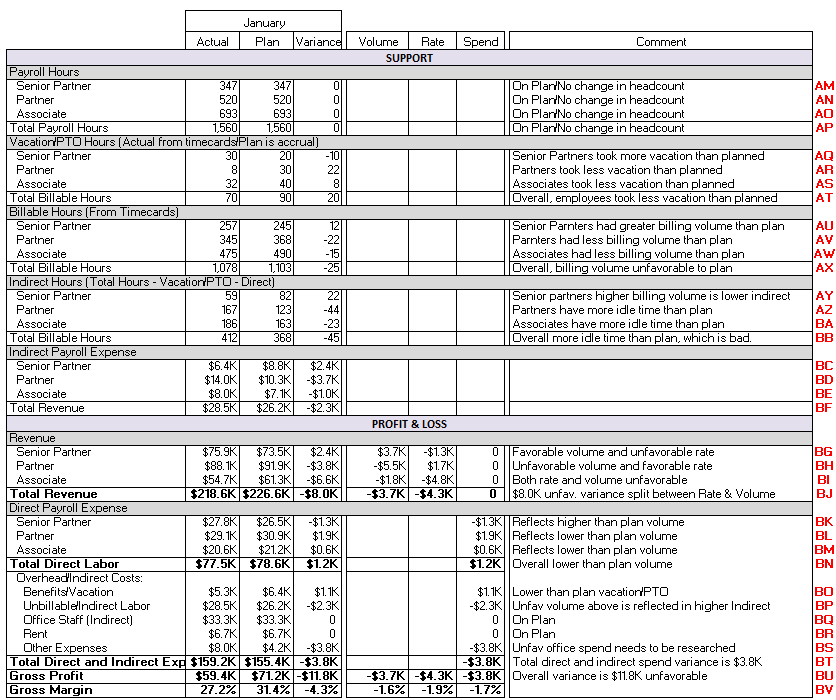
Let’s review the Support section:
- AM to AP is the detail on payroll hours. There was no change in our planned headcount; consequently the planned payroll hours equal the actual payroll hours for all direct employees;
- AQ to AT is the detail comparison of vacation/PTO hours taken vs. planned. Overall, there were fewer vacation hours taken than planned in the month of January.
- AU to AX contains the hours that can billed to clients by category. If you look closely, you can see that Senior Partners invoiced at a higher volume than planned while the other two employee categories billed less than plan. In total, the hours billed was 25 hours less than planned, which is a bad thing for profitability;
- AY to BB reflects the number of hours of indirect time for our 3 direct employee categories. For the direct employees, indirect time is not a good thing because it is increasing the overhead pool and reducing the number of billable hours. For the month of January, total Indirect time was 25 hours above plan, increasing the overhead pool $2.3K (see row BF);
- BC to BF just summarizes the indirect expense that flows from the indirect hours.
Now let’s take a look at the Profit and Loss section:
- BG to BJ is the split of revenue variance between rate variance ((Actual Hourly Rate – Plan Hourly Rate) * Actual Hours) and volume variance ((Actual Hours Billed – Plan Hours Billed) * Plan Hourly Rate). Looking at row BJ, there was $3.7K unfavorable volume and $4.3K of unfavorable rate variances, totaling a $8.0K unfavorable revenue variance;
- BK to BN is the labor that is directly correlated to the billing hours. It is slightly favorable because billing volume is below plan;
- BO reflects the favorable Benefits/Vacation variance due to lower vacation hours charged;
- BP is the amount of Indirect Labor charged by Direct Employees for training, meetings and idle time;
- BQ is the payroll for office staff that does not direct billing;
- BR is office rent, which was right on plan;
- BS was overrun for the office supplies by $3.8K;
- BT is the total line for both direct and indirect expenses, which was overrun by $3.8K, mostly attributable to the office supply overrun;
- BU summarizes the gross profit which was $11.8K unfavorable with $3.8K relating to indirect expenses and $8.0K due to under delivered direct hours.
- BV is the gross margin variance.
As a summary review tool, we created the following bridge to help managers better understand the scale direction of the gross profit variances. As you can see below, all three variances are unfavorable and of nearly equal size.
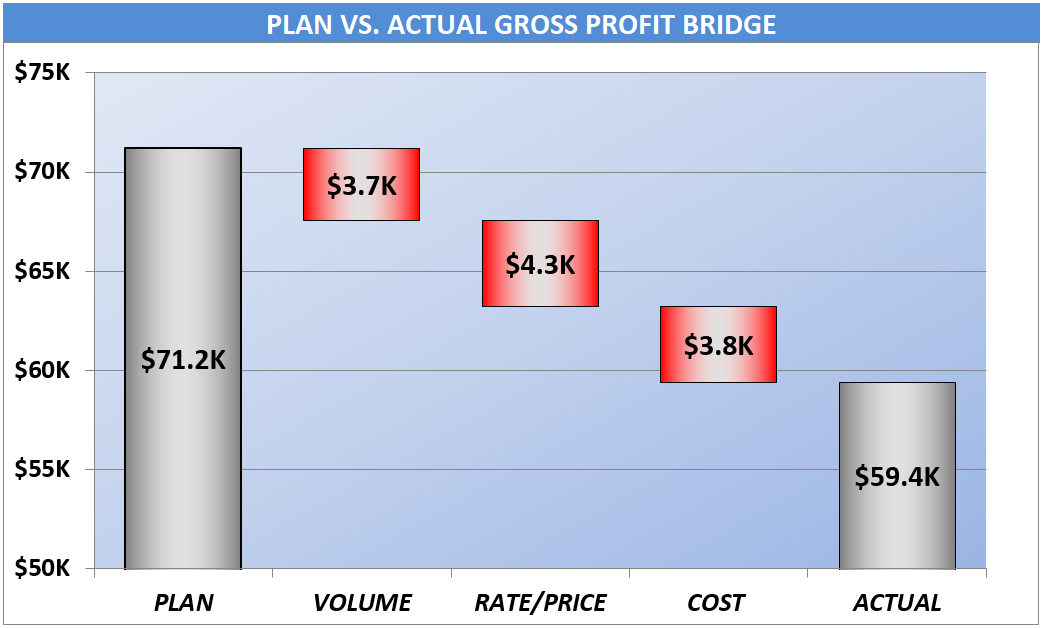
Finally, with all this information at hand users can begin to make better decisions about corrective actions. The items we highlighted include:
- Need to better understand why there’s an unfavorable rate variance for Senior Partners;
- Why were all categories of direct employees below the planned number of hours to be billed. Do we need to get more new business? Work with the direct employees to help them better understand the scope of their assignments or potentially adjust staffing levels; and
- What happened with business expenses and what can we do to get them under better control.
In Summary
If you would like to get copies of any of the above referenced Excel models, feel free to reach out. We hope you found our approach to improve professional service firm profitability helpful, as well as finding a couple of kernels you can apply to your business. If you need assistance applying any of these ideas to your business, please contact us today.

Other relevant posts: