
TABLE OF CONTENTS
- Using Calendar Dimensions in Your Financial Reporting
- First, create a query that can determine the inclusive dates for our twelve-month rolling window
- Next, how to use our subquery (LastMonth) to limit the data returned from our data warehouse
- Using the 12-Month Rolling Shipments query in a Power Pivot example to filter for the most recent rolling twelve months of shipment history
- Refining our Power Pivot Data Model by linking the Calendar table and 12-Month Rolling Shipment history query
- Adding a Power Pivot table using our new Data Model
Adding an Accounting Calendar to Your Data Warehouse Architecture Improves Financial Analysis
Using Calendar Dimensions in Your Financial Reporting
In our previous post, we described the structure of our Accounting Calendar and defined all the fields in the Calendar table, as well as provided a link to our a CSV file with all the detail Calendar table records, from 1/1/2008 through 12/31/2028 , that can be imported into your own application. In this post, we are going to illustrate how a data warehouse architecture can leverage an accounting calendar that we are sure you will find helpful. We are going to use our accounting calendar to generate a rolling twelve-month data extraction for a Power Pivot application.
Summarizing results by year or month or even by day is s fairly simple task, but generating a rolling twelve-month data extraction is more complicated, given that we want our application to be able to determine which twelve months are the most current without having the user provide the date ranges.
First, create a query that can determine the inclusive dates for our twelve-month rolling window
Though we are getting ahead of ourselves, our data warehouse architecture has a number of both master data tables (customer master, sales rep master, etc.) and transactional tables (shipment history, inventory level history, etc.). We will get into more details regarding these tables in the next post, but suffice for now that we have a shipment history table, named TransactionalShipments, that contains, as one of its 12 fields, a date field named Ship Date. The Ship Date field represents the date that each line item was shipped to the respective customer.
Using the Access Query Design window, we have created a query that references TransactionalShipments, and our Calendar table. As you can see we are linking the two tables on date fields–Calendar:Date is linked to TransactionalShipments:Ship Date. Take a look at the snippet below.
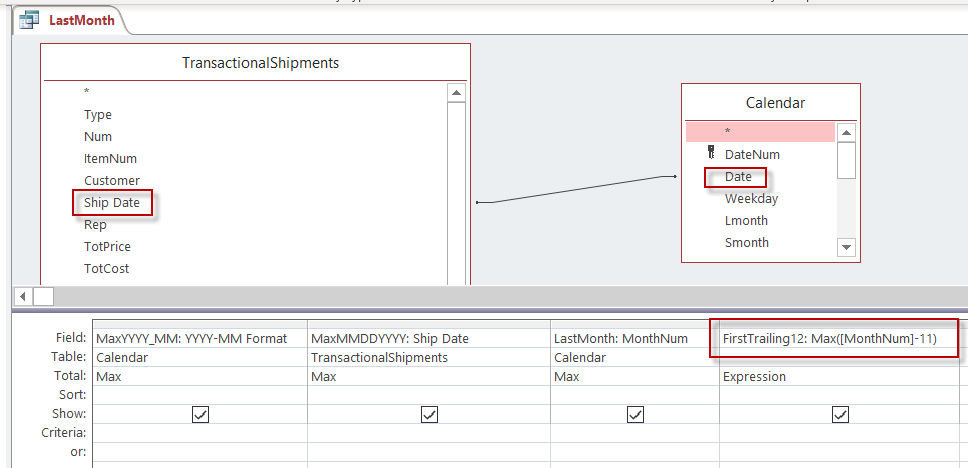
The query above is going to return four fields, all of which are going to be driven by the last or max date in TransactionalShipments. Here are the fields that will be returned:
- MaxMMDDYYYY: This is the last date from the TransactionalShipments table and really drives all the reporting. All the other dates from the Calendar table are a function of the last date of transactional data in TransactionalShipments, which is 9/28/2018.
- MaxYYYY_MM: This comes from the Calendar table and is the Max YYYY-MM formated month for September 2018, which is 2018-09.
- LastMonth: If you look closely at the Calendar table description in the prior post, there is a field named MonthNum. MonthNum is the sequential month starting from the beginning of the table. In the Calendar table, September 2018 is the 129th month.
- FirstTrailing12: Many of our reports are going to be based on twelve months of rolling history. In this instance, the most recent month is September 2018 making the first month in our twelve-month rolling history October 2017. If you look at the query, we are using the Max function in an expression to compute the MonthNum index that is 12 months prior to the most recent month end. The formula is Max(MonthNum)-11, which equals 118. In our Calendar table, month 118 corresponds to October 2017.
When we execute this new query, that we named LastMonth, it returns the following data:

As you can see above, the query returned 2018-09 as our last month of actual shipments, 9/28/2018 as the numeric date of the last shipment, 129 as the last numeric month of shipment history in our index of months and 118 as the first month in our rolling sequence of twelve months (e.g. Sep 2018 = 129, Aug 2018 = 128, …. Oct 2017 = 118). This query will be used as a subquery by our next query in this example to filter the amount of shipment history data returned, eventually to a Power Pivot example.
Next, how to use our subquery (LastMonth) to limit the data returned from our data warehouse
Again, using the Access Query Design window, we have created a new query by adding in the TransactionalShipments table, Calendar table, linked on their respective date fields, and the LastMonth subquery. Note that the LastMonth subquery is not linked to any of the tables, but is referenced in the Where clause for the MonthNum field. This is where the filter will be set to limit the records returned to a rolling twelve months.
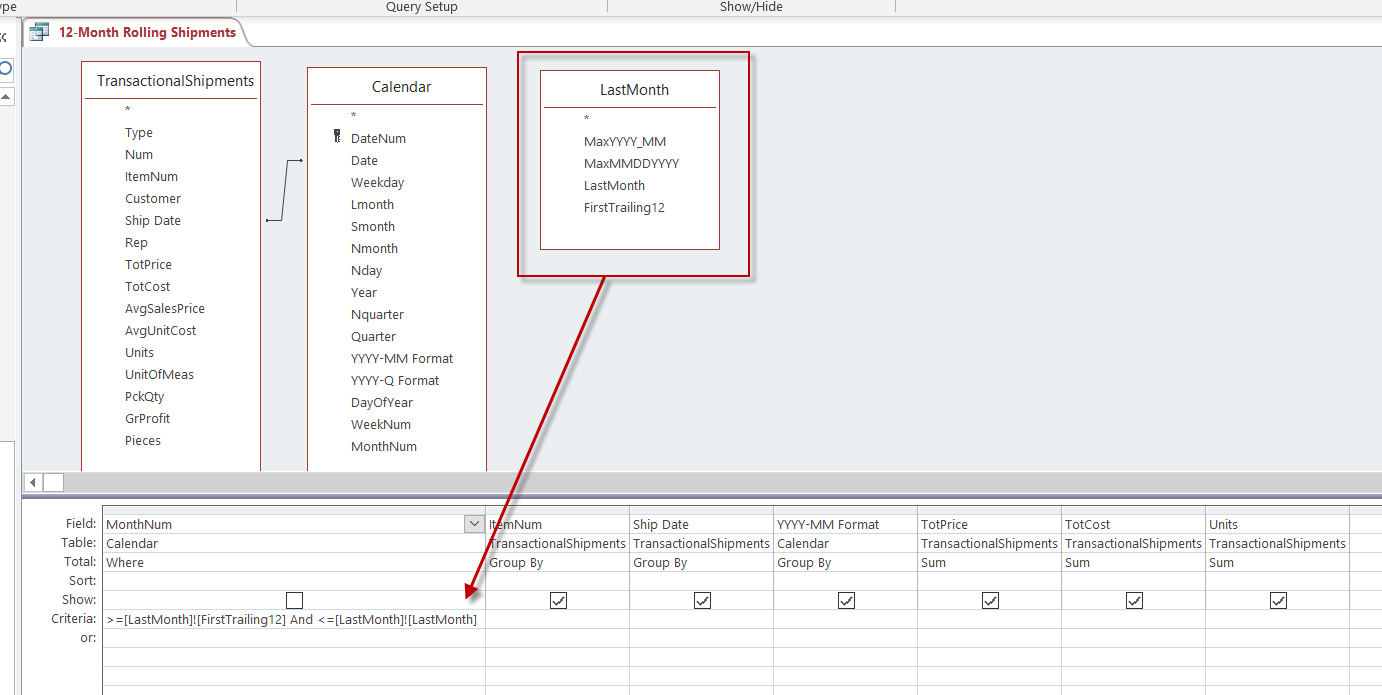
Here is a little close look at the Where clause inthe MonthNum field:
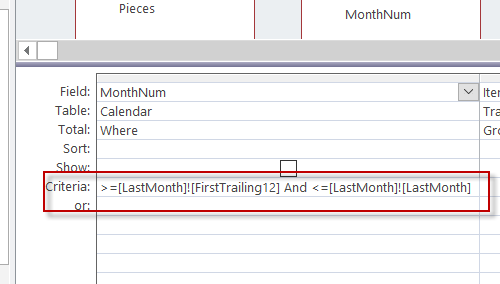
The above field will limit the data using the LastMonth subquery by limiting the records returned to only the months that are greater than or equal LastMonth:FirstTrailing12 (which was equal to month index 118 and equates to Oct 2017) and less than or equal to LastMonth:LastMonth (which was equal to month index 129 and equates to Sep 2018). Here is the SQL that was generated as part of the query above, that you can paste into the Access query window:
SELECT TransactionalShipments.ItemNum, TransactionalShipments.[Ship Date], Calendar.[YYYY-MM Format], Sum(TransactionalShipments.TotPrice) AS SumOfTotPrice, Sum(TransactionalShipments.TotCost) AS SumOfTotCost, Sum(TransactionalShipments.Units) AS SumOfUnits
FROM LastMonth, Calendar INNER JOIN TransactionalShipments ON Calendar.Date = TransactionalShipments.[Ship Date]
WHERE (((Calendar.MonthNum)>=[LastMonth]![FirstTrailing12] And (Calendar.MonthNum)<=[LastMonth]![LastMonth]))
GROUP BY TransactionalShipments.ItemNum, TransactionalShipments.[Ship Date], Calendar.[YYYY-MM Format]
This is why I really prefer using the Query Design window, which is more intuitive for me than thinking through the SQL. We named this query 12-Month Rolling Shipments, which will be used in our Power Pivot example next.
Using the 12-Month Rolling Shipments query in a Power Pivot example to filter for the most recent rolling twelve months of shipment history
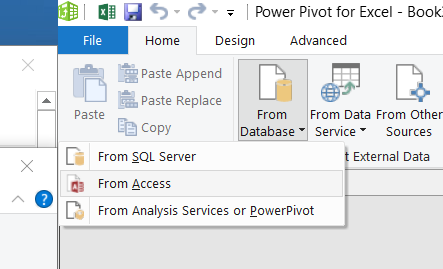
Now we shift over to Excel to illustrate how to your data warehouse app can really begin to leverage an accounting calendar. Starting with a blank Excel workbook, we are going to navigate to the Get External Data function from the Power Pivot Data Model function (Excel -> Power Pivot -> Data Model -> Manage -> Get External Data. This post is not meant to be a detailed primer on how to use Power Pivot, but you can use this link to learn more from a YouTube video on the same subject. Once on the Excel screen below, you will select to get data from Access as shown below. This will bring up a dialog that allows you to navigate to the Access database for your data warehouse application bring up a list of tables and queries that can be imported into your Power Pivot data model.
Once we were able to select the tables and queries in our Access database, we selected to import the 12-Month Rolling Shipments query and the Calendar table. We want the Calendar table because it will allow us to summarize our query in various ways, such as by year, month, quarter, weekday, etc. Just remember that we are only returning the 12 months of shipment history in this example. Generally you would want to limit the data going to your report consumers so that they are not overwhelmed with data.
Refining our Power Pivot Data Model by linking the Calendar table and 12-Month Rolling Shipment history query to leverage our new data warehouse architecture
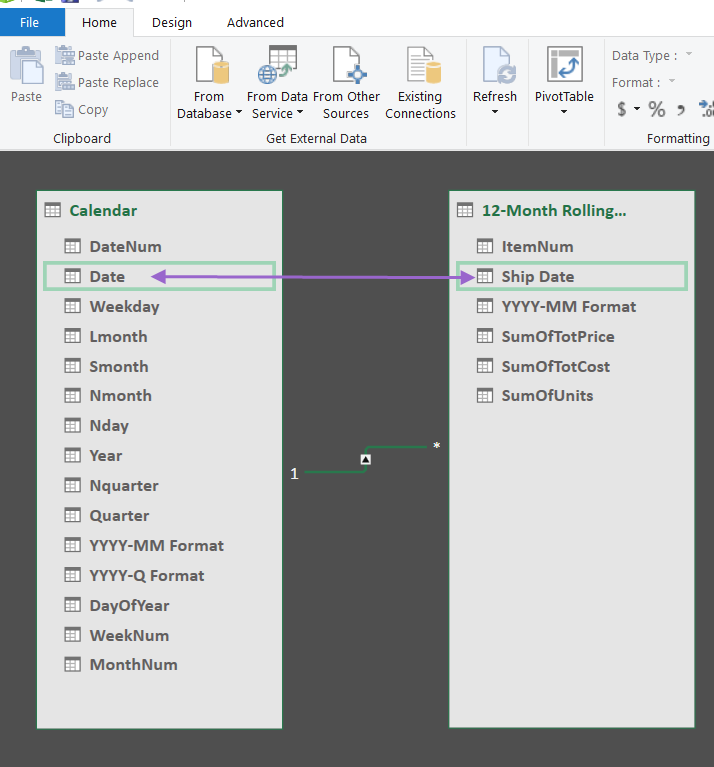
Now quickly navigating to the Home -> View -> Diagram View you will see the two data objects we retrieved from Access and now using the cursor we can link the Calendar:Date field to the 12-Month Rolling Shipment:Ship Date field and we are good to go for now.
Adding a Power Pivot table using our new Data Model
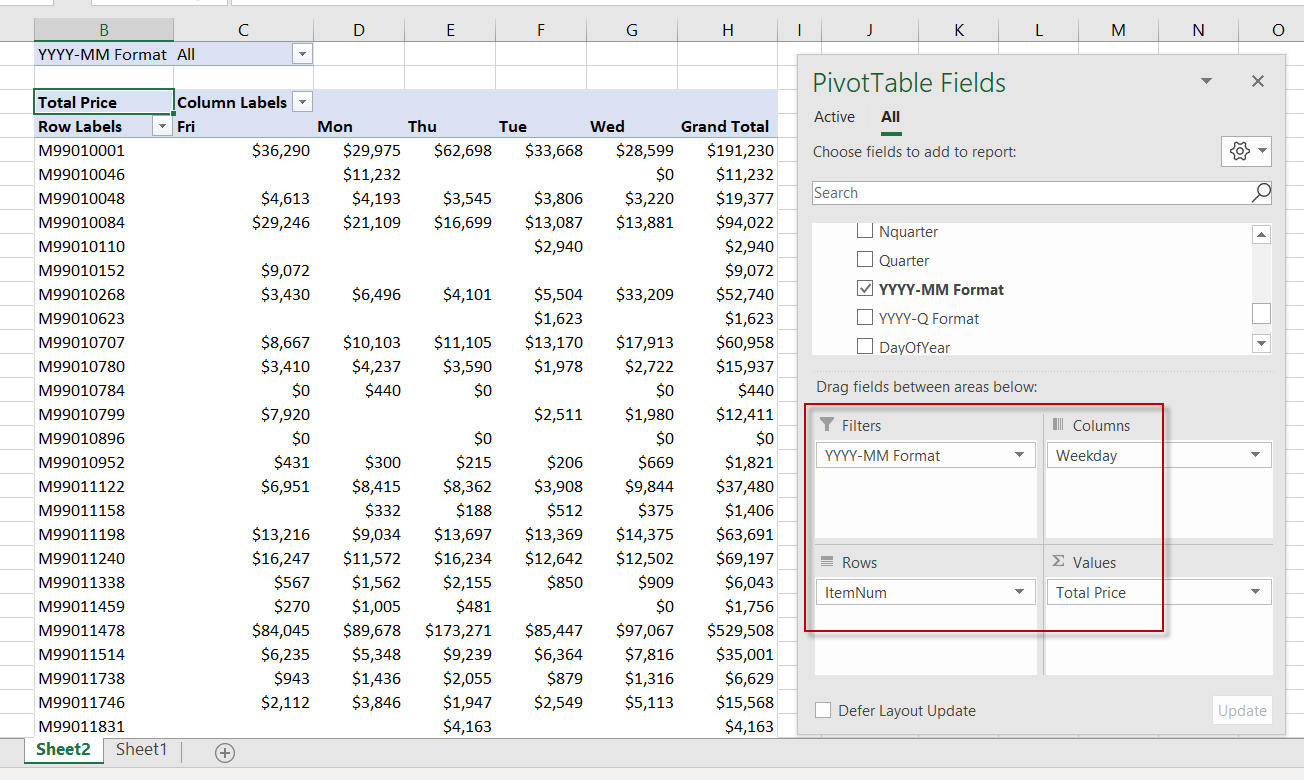
Given that the Access data has been imported into a Power Pivot model and linked, we can now create a new Pivot Table by going to Home -> PivotTable which will add the new Pivot Table to the Excel file we currently have open. Shown below we added the Total Price (total invoice price for each line item) as the Values, the ItemNum as the Rows, Weekday as the Columns and “YYYY-MM Format” as a filter. You can see the result below, which is an example of using our Calendar table to enable analysis by weekday.
The nice thing about setting up a Pivot Table in this fashion, is that once the next, as well as all future, month-end is complete and the Access file is updated, then all that is required is for one of your report consumers to perform a Refresh All to update the Data model with most recent 12 months of shipment history. This is how you really being to leverage an accounting calendar, because we are going to use the same approach to limit month-end inventory results, compute days of inventory on hand, etc.
There is much, much more you do with this data utilizing Measures and DAX, but this was just intended to show you how a data warehouse can leverage an created Accounting Calendar table to great effect.
We hope you found this useful in your endeavors for creating a more insightful data warehouse for your business. If you are a business owner that is looking for ways to leverage your data analytics, please contact us today.

Other relevant posts: