How to Improve Inventory Turnover Ratio Using DIOH
Table of Contents
- Why is Knowing How to Compute DIOH, and Its Impact on Inventory Turnover Important to My Business
- How to Compute Days Inventory On Hand (DIOH)
- Gaining and Utilizing Actionable Intelligence From DIOH Metrics
- Final Comments on DIOH and Managing Inventory
Why is Knowing How to Compute DIOH and its Impact on Inventory Turnover Ratio Important to my Business?
If you have ever wanted to know the meaning of DIOH or needed a formula for computing DIOH, then you have come to the right place. Knowing how to improve inventory turnover ratio using DIOH metrics is a fundamental skill for anyone that needs to optimize inventory levels for customer service levels and/or improved cash flow. DIOH, which stands for Days Inventory On Hand, is a metric for determining how efficiently a product-based business is utilizing an important current asset–Inventory; consequently knowing how to compute DIOH, and what the metric means, is going to be very important relative to any initiative focused on optimizing inventory levels. When we talk about “optimizing inventory levels”, we are describing a process whereby a business is attempting to balance their need for high customer service levels, while simultaneously minimizing the amount of inventory on hand required to meet that customer service level goal.
There are various ways to compute actual customer service level performance, but the simplest would be to divide the number units Shipped in a given month, divided by the number of total units reflected on those Sales Orders. A straightforward way of computing actual customer service level is using how many product units are closed short in a given month, such as this:
Service Level % = (Total Units on All Line Items Shipped – Units on All Line Items Close Short) / Total Units on All Line Items Shipped
Each business needs to determine what their target Service Level % should be given what level of stocks they can tolerate (or their customers will tolerate). This means that a service level of 95% means that a business is willing to accept a 5% stock out rate. You may be wondering why you would not set the customer service level at 100%. Well the reason has to do with the amount of safety stock required to achieve a 100% service level. As one increases the effective service level percent, the corresponding safety stock units required increases dramatically; consequently, businesses need to spend some time thinking through how to balance the cost of increased inventory with the loss of future sales due to some planned level of stock outs.
Regardless of whatever service level is selected, you should understand that DIOH is meant to reflect the number of days it will take a business to consume the inventory on hand using either historical or forecast demand. You can compute DIOH metrics for total inventory (raw material, work in process, finished goods), for an individual finished good and for an individual raw material. The Inventory turnover ratio and DIOH are essentially two sides of the same coin. This is because you can compute DIOH with the inventory turnover ratio and vice versa. To compute the inventory turnover ratio using DIOH, just divide 365 days by the DIOH to get the turnover ratio. For example, if you have a DIOH of 37 days for an inventory item, then your inventory turnover ratio is 12X (365 Days / 37 DIOH = about 12X). The goal is to pursue either lower DIOH or higher turnover. Both have the same effect.
Relative to DIOH, the fewer the number of days you can maintain your inventory at, translates into higher positive cash flow. But your inventory level needs to be balanced with your desired Service Level. Again, a given Service Level pertains to the probability you manage to relative to the probability of a stock out. If you set a 95% Service Level, then you are accepting the possibility of stock outs 5% of the time. More on this later.
How to Compute “Days Inventory On Hand”
Like nearly all accounting metrics, DIOH is retrospective in that you use historical business activity to compute the current monthly metric. As described briefly above, there are two ways to compute DIOH that are a function of what you are measuring. If you are attempting to measure an entire company’s DIOH, you would look to the Cost of Goods methodology. If you are looking at individual inventory items, you would use the Units Consumed methodology.
Computing DIOH Using Cost of Goods
To understand how Cost of Goods is computed, consider what happens when a sales order is fulfilled. When a sales order is fulfilled, inventory is shipped to an end customer and title of that asset transfers from a vendor (you the business owner) to a customer. With that title transfer, the cost of all the items shipped is reduced by the standard or average cost of the items shipped. Or speaking like an accountant, there is a debit to cost of goods and credit to inventory. I hope your eyes are not already glazing over. A cost of goods account on a P&L represents the accumulation of costs for all the items shipped to customers.
In order to compute the actual metric you have to have the period ending inventory valuation, which is a summary of the inventory costs for all inventory items a business possesses or holds title to as of the report date. This will be the numerator in a computation. The denominator will be the average daily Cost of Goods. Generally you calculate the average daily cost of goods by using a 12-month rolling total of Cost of Goods and dividing by 365 days.
Below is an example of the Cost of Goods methodology comparing the inventory efficiency of Walmart vs. Macy’s using their 2020 SEC 10K filings from EDGAR. Both businesses are in the retail industry, but they have rather dissimilar inventory management capabilities. Walmart can be considered “Best in Class” especially when you consider the fact that they ended their 2020 fiscal year generating $395B in cost of goods, and did it ending with $44B of inventory on their balance sheet. In contrast, Macy’s generated $15B of cost of goods, ending their fiscal 2020 with $5B of inventory. Let’s compare the two:
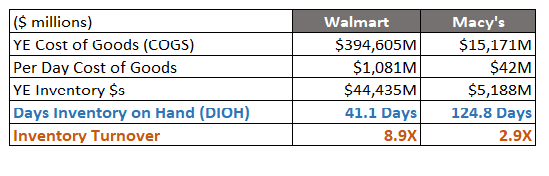
Using Walmart’s SEC filing, we divide their $394,605M by 365 days to $1,081M of average daily cost of goods (if that doesn’t take your breath away…). Then we divide their 2020 year-ending inventory valuation of $44,435M by the $1,082M average daily cost of goods to get 41.1 days of inventory on hand (DIOH). Likewise using Macy’s SEC filing, we get a 124.8 DIOH. We also include their turnover ratios, which are 8.9X and 2.9X, for Walmart and Macy’s, respectively.
So why is this import–because Cash is King! Walmart only needs to hold onto 41 days of inventory while Macy’s needs a 125 day cushion. That is a very “eye popping” distinction. You also need to think about the turnover, with Walmart at 8.9X and Macy’s at 2.9X. This means that Walmart is 3 times more efficiently (8.9/2.9 = about 3) turning over their inventory. Let’s start with the cash issue. Macy’s has $5.2B of cash securing the inventory they need to run their business. If Macy’s was able to approach Walmart’s “Best in Class” inventory performance, they could reduce their inventory from $5.2B down to $1.7B (Walmart’s 41.1 DIOH X Macy’s $42M average daily Cost of Goods = $1.7B). That would free up $3.5B of cash to pay down debt! How about interest expense? Assuming Macy’s pay’s, on average 5% on their outstanding debt, that would free up another $1.8B of cash for other purposes. The reduced inventory, plus reduced interest expense, would increase Macy’s cash flow over $5B. An event like that would no doubt move Macy’s stock back on to the S&P 500!
Computing DIOH Using Units Shipped/Consumed
When analyze a single inventory item, you want to look at the actual units being shipped for finished goods or consumed for raw materials. To perform this type of analysis, you will need to develop reports and potentially a data warehouse, where you can retain historical information on shipments and work orders.
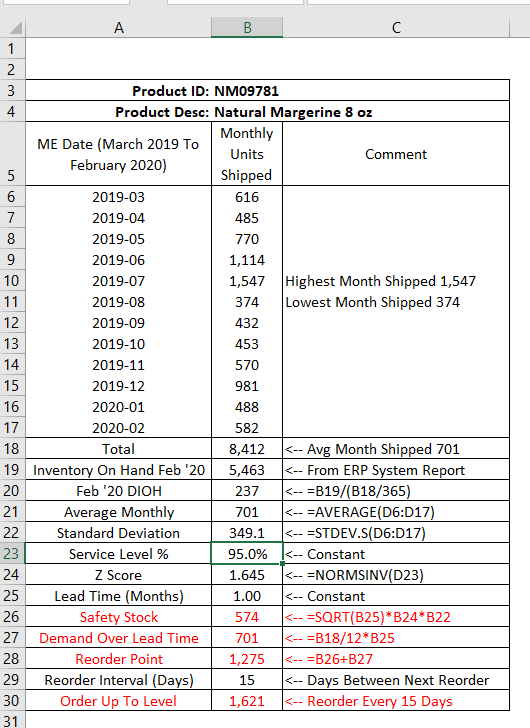
Below is an example of a single finished goods item, that includes some information on the major customers purchasing this items over past 12 months (March 2019 through February 2020), the month-end February 2020 inventory units on hand and the computed DIOH for this one item.
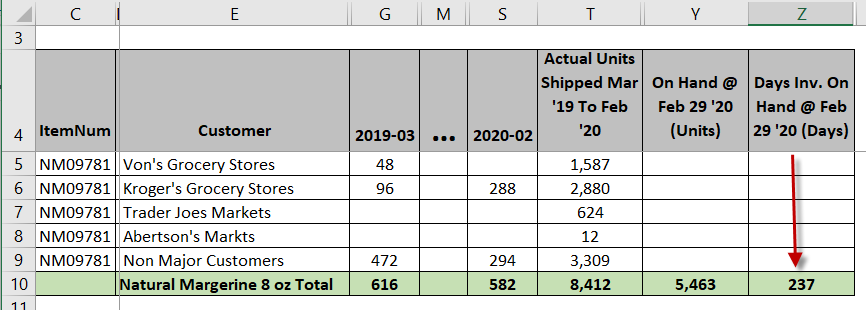
The DIOH is computed in column Z, using the 8,412 units shipped for the most recent rolling 12 months, which comes to shipping on average 23.05 units per day. Then dividing the month-end February inventory of 5,463 / 23.05 units per day means this business is holding 237 days of inventory as of the report date.
Getting a handle on the DIOH for raw materials is a little more complicated. Generally, raw materials are consumed on work orders, during the inventory conversion process, and are subsumed into their parent sub assembly or finished good inventory item.
For example, let’s assume you assemble bicycles and then sell them to bicycle shops. You need to assemble 15 bicycles of the same model. Each bicycle requires 1 front wheel. When you start the work order, you have 100 front wheels in inventory. Once you confirm the work order, you will have only 85 front wheels in your inventory, assuming your Bills of Material are set up correctly of course, and 15 new assembled bicycles ready for shipment. In the case of raw materials, you have to get reports that detail how many units are being consumed on work orders to determine the DIOH for each raw material inventory item. How you do that is beyond the scope of this article, but can be done fairly easily with a data warehouse, where you collect work order confirmation details outside your ERP system.
Gaining and Utilizing Actionable Intelligence From DIOH Metrics
Now that we have a basic understanding of the methods we can use to compute how much inventory we have on hand, let’s spend some time discussing how to utilize this important metric to benefit our business.
The Importance of Understanding Trends — The Big Picture
Gaining actionable intelligence using DIOH starts with monitoring trends. In the Inventory Metrics graphic below you can see that we are measuring the Net Inventory dollars on the left-side Y axis and DIOH on the right-side Y axis. This graph includes how the business ended both 2018 (200 DIOH), 2019 (208 DIOH) and the currently completed month-end February result of 223 DIOH. The dashed line reflects improvement over the remainder of the year, trending down to around 190 DIOH by 12/31/20. Looks like we will need a few initiatives to get there.
![]()
The actionable intelligence from the above is that inventory is continuing to grow faster than sales. That’s a problem. Step #1 is to find an industry benchmark for inventory turns. Knowing your industry metrics should be an imperative for all business owners to better identify low hanging fruit that can put additional dollars in the bank.
Step #2 is develop more robust inventory reporting to begin reviewing the DSR trends for each finished good item. In the report below, we have a 6-month DIOH trend for the NM09781 product we discussed above.
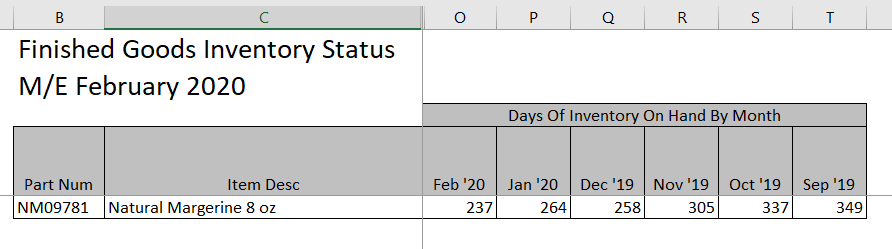
Above, you can see the 237 DIOH for month-end February 2020. In addition to February’s DIOH, you can see the DIOH metrics going back to September 2019, when there was 349 DIOH (or nearly a year’s worth) of inventory on hand. Every month for the past 6 months, inventory has been trending downward. This would indicate that our initiatives appear to be working.
Step #3 is to compute the reorder point (ROP) for this item and work with the Purchasing Department to implement the latest forecast. The typical ROP is comprised of two components, safety stock and stock consumed during the lead time required to replenish the inventory item (AKA demand over lead time). Lets run through an example.
How to Compute Reorder Points Using Safety Stock and Demand Over Lead Time
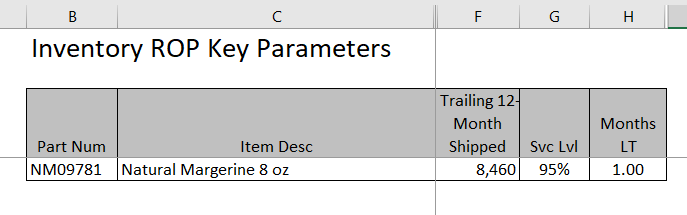
To start our ROP update process, we retrieved the following information from the Purchasing department regarding Item Number NM09781:
How to Compute Demand Over Lead Time
First thing to compute is demand over lead time, which is just the amount of stock we plan to ship/sell during the time required from the day a Purchase Order is placed to the day the stock arrives on our dock. In this example, we have a lead time of 1.00 month combined with a trailing 12-month shipment history of 8,460 units. The demand over lead time will just be 1/12 of the annual demand or 1/12 X 8,460 Units, which equals 705 Units. As I said, the demand over lead time is fairly simple. Now for the safety stock, which is more complicated.
How to Compute Safety Stock
In order to compute the safety stock, we need the following:
-
-
- Service Level % — This is the probability of an item being in our warehouse when an order is scheduled for shipment. Or 1 minus our Service Level % is equal to the probability of a stock out. Generally, 95% is a reasonable place to set your Service Level %. As you increase the Service Level %, the amount of additional inventory required to get 1% higher Service Level begins to get massive. Conversely, if you want to lower total inventory and are willing to increase your chance of a stock out, then you may want to lower your safety stock to 93%, or whatever. For our example, we are going with 95%.
- Lead Time — We already know that our assumed lead time is 1 month.
- Z Score — Hopefully you had a statistics course or two in college. A Z Score is the way that we effectuate a statistical estimate of safety stock based on our service level %. The easiest way to get a Z Score is with Excel. Just use the following formula which will produce the correct Z Score: =NORMSINV(SS%). By using Excel, a 95% service level will produce a 1.645 Z Score. The lower your service level, the lower the Z Score.
- Standard Deviation — We need the standard deviation of demand over some period of time. Given that we have our lead time and historical demand all summarized by month, we need a monthly standard deviation for our product. This is fairly simple using Excel, which has a number of methods for computing standard deviations. Given that we are only going to use 12 months of past shipment history, we are going to use the Student’s T Standard Deviation formula which is: =STDEV.S(Range). If you have 30+ data points, then use the Population standard deviation formula (=STDEV.P(Range)), which will give a lower safety stock value, reducing the amount of overall inventory required to maintain the same Service Level %.
-
Here is an example, for the same product we have been discussing, using the 95% Service Level, 1 month Lead Time:
Though the above is a bit complex, creating a VBA application will make this much easier, which is a service provided by Profitwyse. The difficult part is establishing a data warehouse were all the information required to compute the analytics can be accessed by a VBA application. We can help with that too!
One final metric that is helpful for your Purchasing team is to compute a forecast date for the next Purchase Order. Think of this as the date when the on hand inventory balance reaches the Reorder Point. In the above example, the information is as of month-end February 2020 (or 2/29/2020).
Here’s the way to approach an answer to the question when will need to issue the next PO. Hopefully inquiring minds in the Purchasing Department would like the answer. As of ME Feb ’20, we have 5,463 units on hand. The reorder point is 1,275. Now we just need to determine how many days to get from 5,463–Units on Hand–to 1,275–ROP–the difference being 4,188 units. Using the information above, we can determine how many days it will take to sell 4,188 units, which is 4,188 / (8,412/365 Days) = 182 days. Adding 182 days to the ME report date indicates that Purchasing will not need to take action until around August 29, 2020. Using this report, the Purchasing department can focus on more pressing issues than our example part above.
Final Comments on Days Inventory On Hand
Though we did not mention it above, knowing your industry average DIOH performance or inventory turn over rate is very important relative to providing some objective direction on how aggressively to pursue inventory reduction initiatives. Regardless, business owners should always take a continuous process improvement philosophy to their inventory improvement initiatives, given that inventory management is a balancing act between maintaining reasonable inventory levels that also achieve service level goals.
BONUS! Looking for an Efficient Solutions to Plan Your Daily Cycle Counts?
Check out the YouTube video below to learn you to simplify and streamline your periodic daily cycle count planning process. Here’s
Establish Your ABC Coding Strategy
The tool has a worksheet where you list all the inventory items you want to cycle count, providing fields for Part ID, Description, Assignment Criteria and ABC Code categorization. The Assignment Criteria column can contain whatever metric you would like to utilize when determining whether a Part ID is going to be an A, B or C part, e.g. units shipped, units manufactured, units consumed, or whatever works for your organization. Given your Part IDs, count frequency assumptions for A, B and C parts, the tool will compute the total number of counts you will need in a given year to fully comply with your preset cycle counting objectives.
Establish Your Cycle Count Calendar
Given that the cycle count planning tool is going to assign Part IDs to be counted on predetermined days, you have to specify the following: 1) days of the week your staff will be cycle counting (or not, such as Saturday and Sunday). If needed, you can elect to cycle count 7 days a week but typically it will be Monday through Friday. Additionally you can omit a weekday for the counts, e.g. no counts on Fridays. You will also need to input you holiday schedule if you are not going to be counting on Christmas Day (assuming it falls on a weekday). You can set 20+ holidays or other dates (such as a pre-planned all hands meeting where no cycle counting will be performed). Once you have set you calendar, there is a Build Calendar button where a macro will build out your cycle count calendar with all the dates that cycle counting will be performed.
Generate Your Daily Cycle Count Plan
Once you have set your ABC coding and cycle count calendar, you can push the Build CC Plan button, which will initiate a VBA program that randomly slots each part in a cycle count plan that aligns with your specifications for A, B and C part count frequencies. The result will be written to an Excel Table, with the planned count date and Part ID to be counted on that date for the time period specified, typically a year. Saving the cycle count daily plans to an Excel table makes it very easy for whomever is administrating the cycle plan to just filter for a month, print the data and send it off to the cycle count team for execution.
Check Out The YouTube Video Below for Additional Details/Demonstration
Get more information and/or request your copy of the Cycle Count Plan tool.
If you are a business owner that is in need of inventory management expertise to help implement your own continuous improvement initiative, please contact us today.

Other relevant posts: