How to Build a Time-Phase Sales and Cost Plan for Gross Margin Analysis
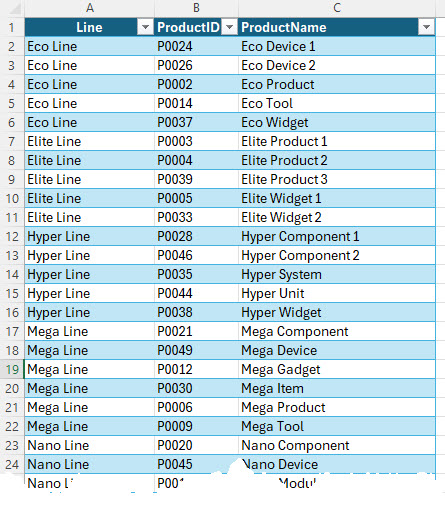
In the above structure, we have 10 Lines and 50 products slotted into those 10 Lines.
Build out the Plan Workbook – To compute Gross Profit and Margin we will need to create a Revenue worksheet, a Cost of Goods worksheet and a Gross Profit worksheet, all three mimic the other in column and row structure. This facilitates a couple of objectives that we will discuss shortly.
- Revenue Worksheet – The structure of each of the three worksheets will start with a page title section (rows 1, 2 and 3) a header section (row 40) and then all the product detail begins at row 6 (row 5 was added for aesthetics). Here’s a snippet of the Revenue worksheet:
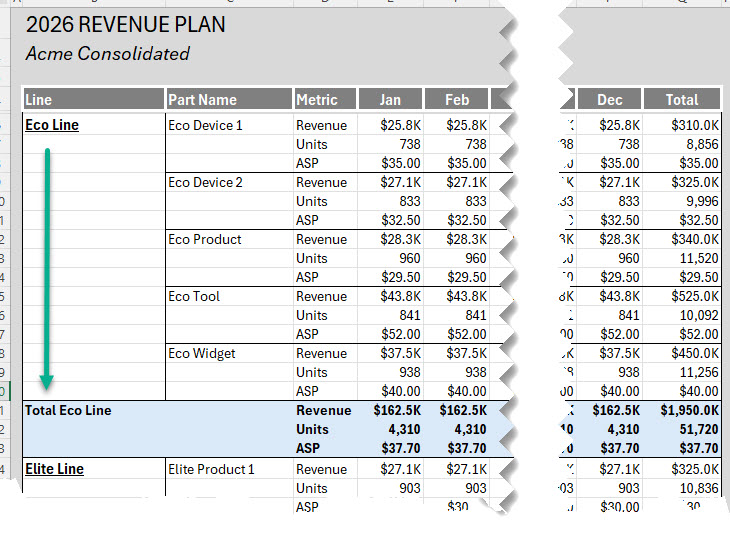
Above you can see that we started with the Eco Line at column B and began listing the products at column C. There are the three metrics for each product—Revenue $s, Units Shipped and Average Sales Price (ASP)—for each product. You will have to work with your Marketing team to determine the input metrics, for example do they want to provide the Revenue and ASP and let the worksheet back into the Units shipped. The months are referenced in columns E through P and a total column at Q. The same format is used for all 10 of the Lines (rows 6 through 185. Finally there’s a Total for all 10 Lines at the bottom (rows 186 through 188).
- Cost of Goods Worksheet – We used the same structure as was used for the Revenue Worksheet, except for the metrics. Here the Units shipped come directly from the Revenue Worksheet. The other two Metrics, COGs (cost of goods) and Unit Cost can be computed using either total COGs to compute Unit Cost or vice versa. Most likely, Operations will be providing target standard or average costs by product that you can just plug into the model to calculate total COGs for each product.
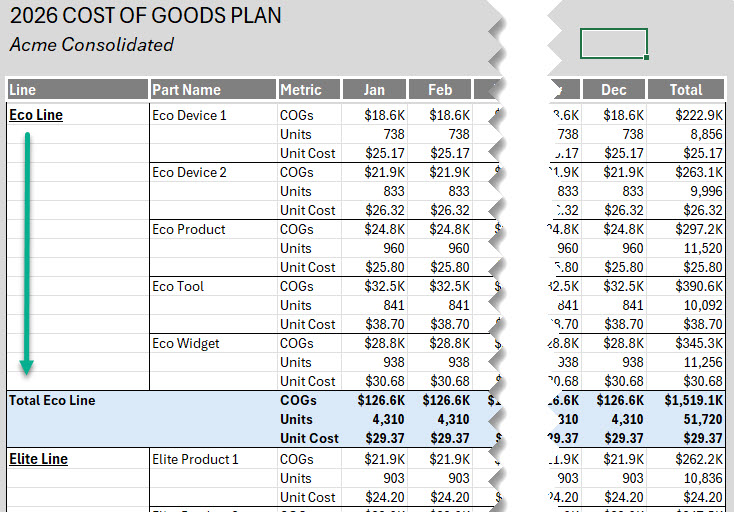
Again, there are 10 sections for each Line with the individual products that tier to that Line summarized.
- Gross Profit Worksheet – Each same structure as the two previous worksheets, relative to rows and columns, but this worksheet is the reason for the entire process—calculating the gross profit and margin by product, by line and in total.
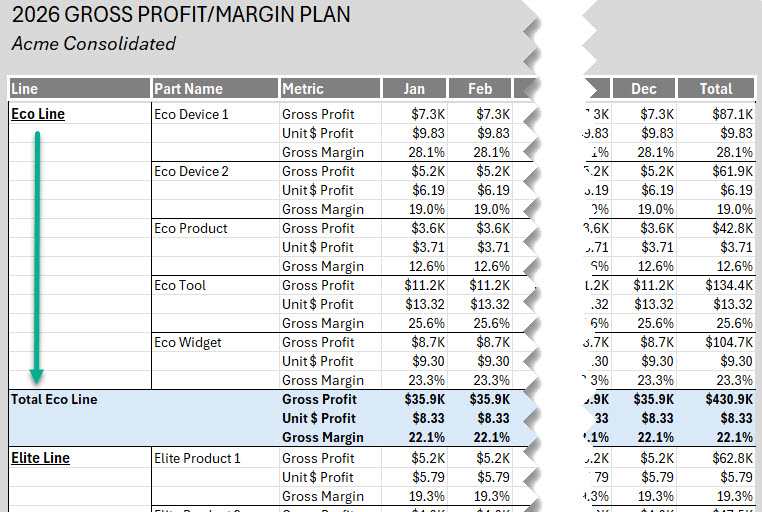
Gross profit is just the Revenue worksheet minus the COGs worksheet with a simple formula, such as this for the Eco Device 1Jan:
=PlanRevenue!E6 – PlanCOGS!E6
Gross margin is the gross profit $s divided by the Revenue (we included a little logic for the times when there’s no Revenue nor Gross Profit planned:
=IF(PlanRevenue!E6 = 0, “” ,E6 / PlanRevenue!E6)
Finally, we created a Unit$ Profit which will be relevant once we get into the gross margin analysis phase:
=IF(PlanRevenue!E7 = 0 ,”” ,E6 / PlanRevenue!E7)
That’s pretty much it, get your own copy of this workbook to view more of the details, if needed.
Once I have my Gross Profit/Margin Model built out, what’s next?
Next Steps in the gross margin analysis process:
- Duplicate the three worksheets for Actuals, using the same structure (RevenueActuals, CostofGoodsActuals and Gross ProfitActuals). Again, you need to look to your ERP system or wherever you are retrieving your actual shipment results to determine what needs to be input and what should be calculated. For example, if your ERP system is producing data such as this snipped:
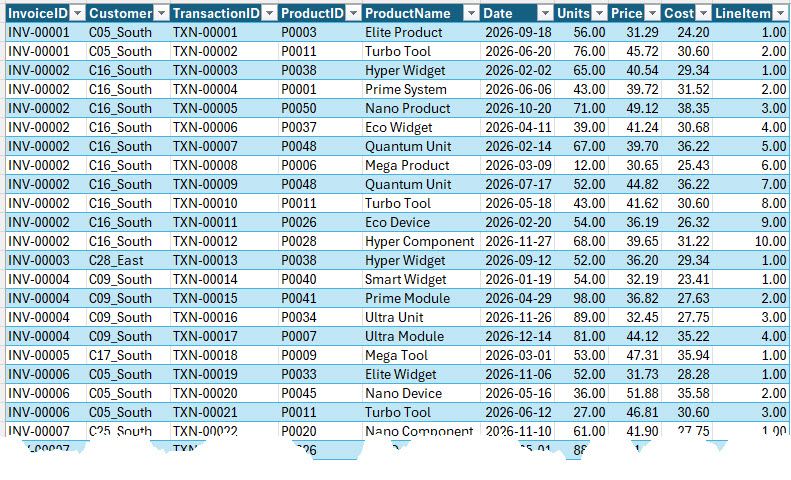
Above, you will want your worksheet to compute actual Revenue $s by multiplying the invoice units shipped and price per unit. The same for Cost of Goods—units shipped times the cost per unit to derive total COGs.
The Gross Profit/Margin worksheet can be the same calculations as the plan given the numbers are functions of Revenue and Cost of Goods.
-
- Duplicate the RevenueActuals, CostofGoodsActuals and GrossProfitActuals to create three new worksheets for tracking variances, e.g. RevenueVariance, etc. This is a great way to begin tracking the detail variances to gain some new insight into how your business is performing against its goals.
-
- Go even deeper on Gross Margin analysis with our 9 Steps to Generate Insightful Gross Margin Bridge Using Excel tutorial with explanation on all the calculations required to parse your Gross Profit/Margin variance into price, cost, volume and mix components, generating the data needed to take action on profitability improvement opportunities.
-
- If you’d like to go even further, we are generating a new tutorial on how to utilize Power Pivot and Power BI for performing Gross Margin analysis. For example, you can use Power Pivot to transform your revenue plan from the somewhat static presentation we described earlier, which is very helpful for getting your plan established, but is suboptimal for analysis, into a flat file that looks like this:
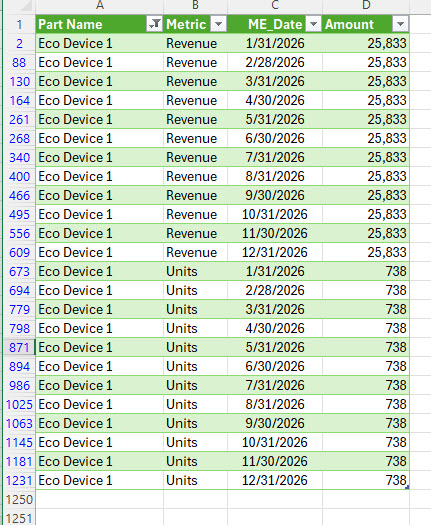
Subsequently, you can add in the Cost of Goods and utilize DAX formulas to bounce your plan up against your actuals to perform deeper analysis, such as in addition to gross margin vs. plan you can also analyze vs. prior year and look at what’s happening with customers. Sound interesting? Feel free to reach out and learn more and get your own copy of the workbook.
If you’re looking to get more from Excel in your business, please contact us today.