Practical Data Analytics Know-How
Empowering Your Sales Team: Business Analytics Strategies for Success
As financial and accounting experts dedicated to enhancing organizational performance, our pivotal role extends to empowering key functions, notably the Sales Team. Recognizing that our Sales partners may not be as well-versed in sophisticated business analytics, we strive to deliver easily digestible applications that drive sales growth. Bridging the gap between complex data insights and practical sales strategies, our efforts ensure tangible and meaningful analyses, ultimately empowering your Sales Team for future success. Elevate your sales performance with our tailored business analytics solutions such as the one described in this lesson. Better utilize statistics to deliver profitable results!
Building a Data Warehouse for Robust Analytics Requires a Versatile Account Calendar
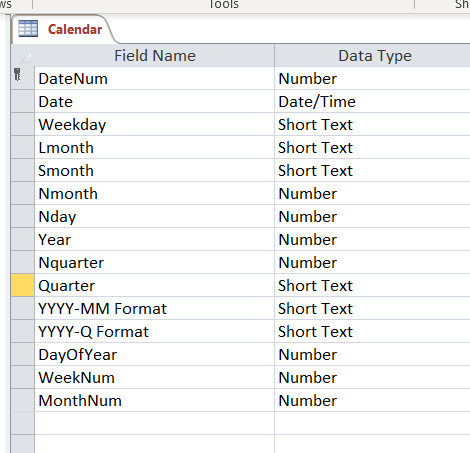
Unlock the power of data precision for your business with a versatile accounting calendar – the often overlooked but crucial first step in optimizing your data warehouse. Choose between a traditional calendar or a 4-4-5, 5-4-4, or 4-5-4 pattern, tailored to your fiscal year end. Navigate the intricacies seamlessly with our guide on creating a calendar aligned with the normal calendar, boasting a December 31st year end. Simplify your journey to data clarity – request a CSV copy of our customizable accounting calendar to effortlessly integrate into your system. Revolutionize your data strategy and future-proof your business with precision and ease!
Designing Master Data and Transactional Tables for a Data Warehouse
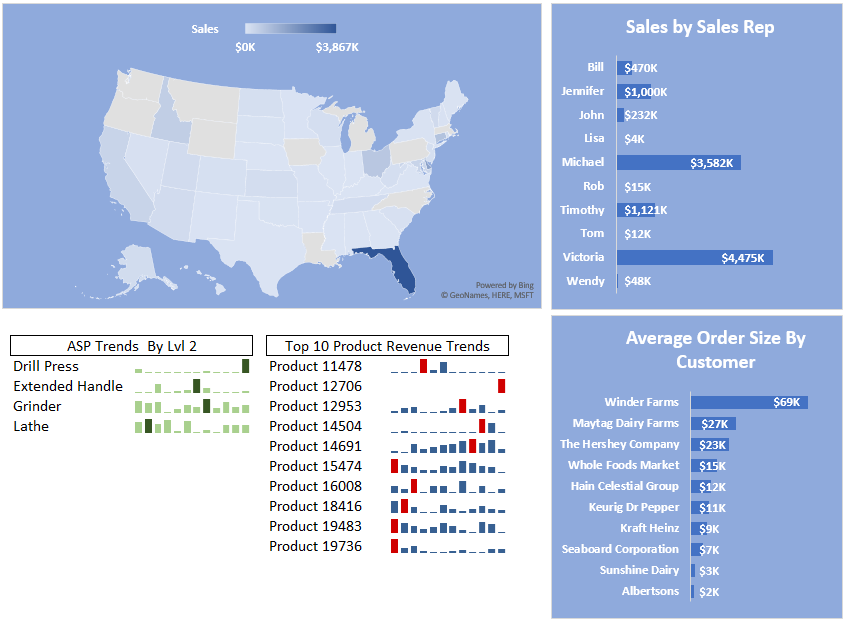
In this lesson on building a data warehouse, we are going to focus on designing master data and transactional tables along with dimensions in a data warehouse. Our example is going relatively basic, but even with at a rudimentary level of complexity we can generate copious amounts of insightful data analysis. The source accounting/ERP system generating the data used in this example could be coming from anyone of the typical midsize business systems, such as Fishbowl, Sage xx0 or even QuickBooks. We have an example of the final dashboard that you can view to better understand the final goal of this series.

Adding an Accounting Calendar to Your Data Warehouse Architecture Improves Financial Analysis
In this lesson you will discover the transformative potential of an accounting calendar within a dynamic data warehouse architecture. Learn how to effortlessly generate a rolling twelve-month data extraction for your Power Pivot application, simplifying complex tasks and ensuring real-time relevance. Elevate your data strategy with our user-friendly approach, empowering your application to intuitively determine the most current twelve months without requiring user-provided date ranges. Revolutionize your data experience today!
7 Steps to Improved Professional Services Profitability
Continuously focusing on Professional Service Profitability needs to be a categorical imperative for all professional service firms. Improved profitability generates greater gross margins and eventually more cash flow, which should be the goal. In this Lesson, we go over a 7-step process that can be used to focus both on direct labor rates and overhead absorption, which are both key components of improving Professional Service Profitability.


How to Use Return on Equity (ROE) to Super Charge Your Business
Using Return on Equity (ROE) to analyze your business performance is much like a mechanic using a scanner to diagnosis what is ailing your car. This approach was pioneered by the DuPont corporation many decades ago, but still is relevant today. The DuPont Analysis (or formula) can provide valuable insight and keys to business performance improvement for entities both large and small. In this Lesson you will learn how to apply this formula to your own business as well as methods of optimizing performance through the use of Excel Solver.
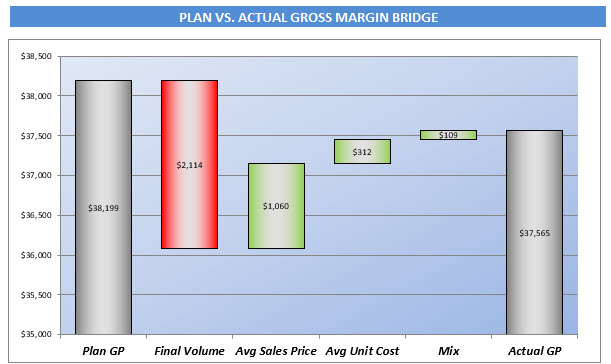
9 Steps to Generate Insightful Gross Margin Bridge Using Excel
Understanding what is underpinning gross margin variances of actual results to a plan or prior actual period is another categorical imperative for business owners, financial analysts and accountants alike. With the knowledge one can gain from analyzing a gross margin bridge, corrective actions become readily apparent, enabling swift correction efforts.
If you want to better understand what is driving gross profit and margin, such as volume variances, cost variances, price variances, etc, then you need to utilize this Lesson today.

6 Reasons Why Financial Planning Matters
A great deal of the Allied Forces success on D Day can be attributed to detail planning (as well as strategy) that was overseen by Dwight Eisenhower. Eisenhower was a proponent of planning, not just as an end in of itself, but the importance of the actual process that required focused thinking.
It his Lesson, we cover 6 reasons why financial planning is important to your business endeavors. Again, it is not just the plan but the process of thinking through options, associated costs, tactics and strategies that enable a business to achieve important goals and break through barriers.