Leveraging Time Series Analysis For Strategic Decision Making
Table of Contents
TOC Listing
Introduction
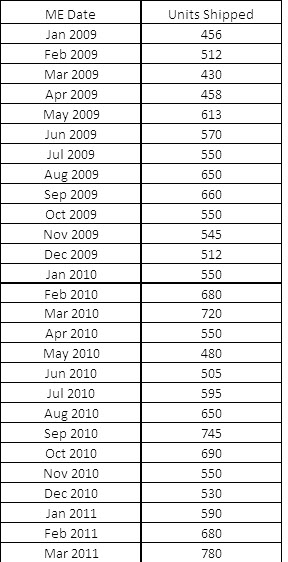
In this addition of Quant Corner, we are going to explore some basic time series analysis concepts. Examples of data commonly forecast via time series analysis include monthly unit sales for a product, quantity of visitors to a website and the number of calls received at a call center. Time series analysis can provide valuable insight when used to optimize resource allocation decisions, such as determining inventory levels needed to achieve an order fulfillment target, predicting network infrastructure requirements for data requests, and evaluating staffing plans for a call center targeted to achieve a call waiting goal. In this primer, we are going to review various ways of forecasting a time series, look at a couple forecast error measurement methods used to evaluate model fit, as well as show how to use Excel’s Solver Add-In to optimize a forecast solution.
As we mentioned at the top, a time series is a set of data points recorded over a specific timeframe. A time series includes the following properties:
- The data points need to have a consistent measurement interval;
- There should be a data point for each interval within the specific timeframe (missing data points should be estimated);
- There is only on measurement at each data point;
- Data that has either a general upward or downward trend will have less error than more random data sets.
As this article progresses, we are going to utilize a number of different methods to forecast our time series data and then analyze each method by reviewing the forecasting error each method produces. Forecasting error is essentially the difference between an actual data point in a time series and the forecast data point derived by our forecasting method at that same time interval. To evaluate a forecasting method, we are most interested in the composite forecasting error. There are several ways to compute the composite error, each of which has its own advantages and disadvantages. Some of the more common ways to measuring composite forecasting error include the following:
- Mean Absolute Error (MAE): This is the average absolute error, calculated by summing the absolute value of each error (actual – forecast) and dividing it by the number of data points forecast. An MAE of 0 would be a perfectly correlated forecast model. Advantages: Simple to implement. Disadvantages: Tends to under emphasis data outliers.
- Mean Squared Error (MSE): This is similar to the above, but each error is squared, summed and divided by the number of data points forecast. This is a good measure of variability.
- Root Mean Squared Error (RMSE): The square root of the MSE is an approximation of the standard deviation. This is the most commonly used measure. Advantages: Commonly used, does not under emphasis outliers. Disadvantages: A little more complex to calculate.
- Mean Absolute Percentage Error (MAPE): This is calculated by totaling the absolute value percentage errors (( Forecast – Actual) / Actual) and dividing that sum by the number of data points forecast. Advantages: More straightforward to interpret since it produces a % error. Disadvantages: Does not work well if there is a large range of variability.
Assumptions Used In Analysis

applies to the Sales Team. That said, our Sales Team partners are not always the most sophisticated users of business analytics; consequently, we need to find applications of business analytics that are easily digestible and drive sales growth.
Finding applications of business analytics for your Sales Team necessitates an ability to bridge the gap between what can be complex data insights and the need to distill those insights into practical sales strategies. With this goal in mind, your efforts will lead to tangible and meaningful analysis that empowers the Sales Team moving forward.
In this article, we are going to cover an application of Excel to create some novel business analytics, using a couple of Excel’s statistical functions, to achieve our goal of bringing meaningful insights to the Sales Team. We will make use significant use of the Normal Distribution, and its characteristics, to create a tool that, on an individual product basis, will provide each Sales Rep with a metric that provides the probably of each customer consuming their last unit one week, two weeks, three weeks and four weeks out from the date of the report.
Business Analytics Strategies That Leverage The Normal Distribution
Before you go too far, let’s discuss the problem and solution. As mentioned earlier, we want a report that can be emailed to our Sales Reps on a monthly basis that will give them some insight into what is being shipped to the customers residing in their territories. In addition to this basic information, we also want to provide some insight into the probably that a given customer has exhausted their most recent receipt of each our products. To this end, we want to show the sales rep the probably of Product XYZ being exhausted one week from the date of the report, as well as two, three and four weeks out from the date of the report. Here’s what our completed report looks like for (sorry but this needs to be viewed on a desktop browser).
Consumption Analysis Report Example for Jerry Jones
Hopefully you found this enlightening and can utilize it in your own organizations. If you need help setting up standard costs, or inventory reduction processes, please give us call. We have the tools to help.

Other relevant posts:
