TABLE OF CONTENTS
- Designing Tables for a Data Warehouse Requires Some Thought
- Access Tables Used in Our Data Warehouse
- Master Product/Part Table with Product Hierarchy
- Customer Master Table
- Sales Rep Master
- Month-End Inventory Transactional Table
- Daily Shipment History Transactional Table
- Outstanding POs is a transactional table
- Reorder Levels is a Master Data table, sort of.
- Table Relationships for our Data Warehouse
- Data Transformation
Building a Data Warehouse Step 3 — Designing Master Data and Transactional Tables for a Data Warehouse
Designing Tables and Dimensions in Data Warehouse Requires Some Thought
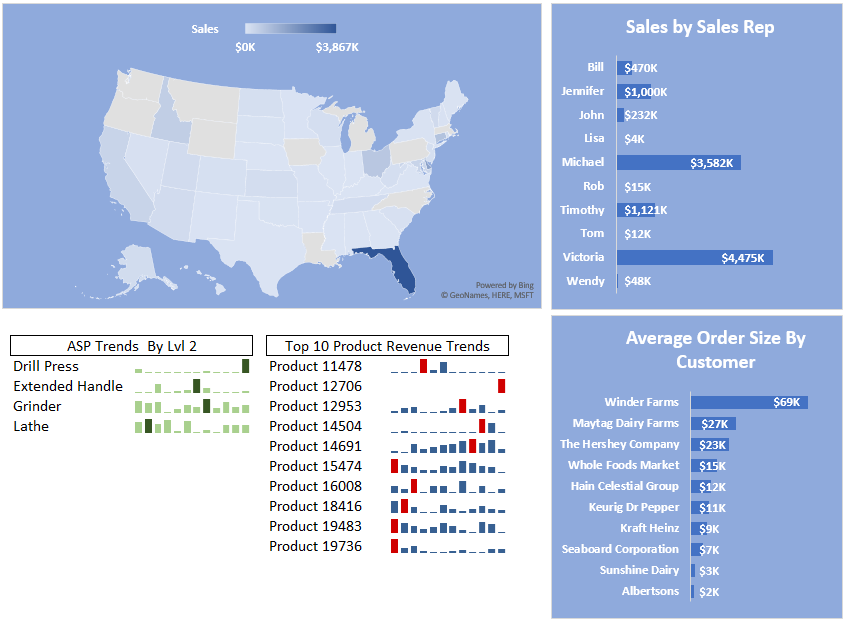
In this next edition of our series on building a data warehouse, we are going to focus on designing master data and transactional tables along with dimensions in a data warehouse. Our example is going relatively basic, but even with at a rudimentary level of complexity we can generate copious amounts of insightful data analysis. The source accounting/ERP system generating the data used in this example could be coming from anyone of the typical midsize business systems, such as Fishbowl, Sage xx0 or even QuickBooks. We have an example of the final dashboard that you can view to better understand the final goal of this series.
Access Tables Used in Our Data Warehouse
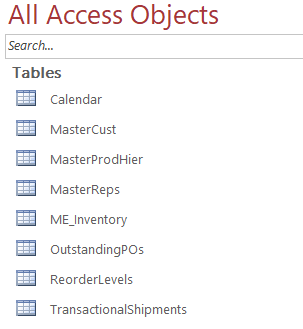
The list of tables in our Access database is displayed below. We will describe each table in more detail in a moment. The Calendar table was described in our earlier post that explained how to build an accounting calendar, which you may want to review if you have not already done so.
Our data warehouse application consists of three master data tables, including: 1) MasterCust for customer master; 2) MasterProdHier for Product IDs and other dimensions pertaining to Products/Parts; and 3) MasterReps as the Sales Rep Master. There are also three transactional tables as follows: 1) ME_Inventory contains the month-end physical inventory status; 2) TransactionShipments contains the daily shipment history for each invoice line item and 3) OutstandingPO has the purchase order history at each month end. The ReorderLevels table is more of a scratch pad.
Master Product/Part Table with Product Hierarchy
The MasterProdHier table contains most of the important dimensions required for our data warehouse application. The focus of our application is go to be finished goods, but raw material could be referenced in this table as well, though we would want to add a field identifying which parts were finished goods and which were raw materials.
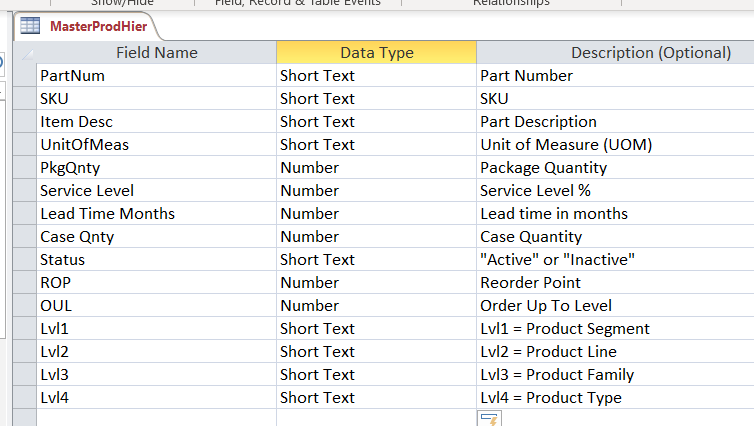
Each of the fields are as follows:
- PartNum: Unique part number
- SKU: Stock Keeping Unit or generally the customer facing part number or a UPC code.
- Item Desc: Brief item description
- UnitOfMeas: Unit of Measure or UOM
- PkgQnty: Quantity contained in a single unit. So if the UOM is ounces and there are 16 ounces in a single sale unit, then the PkgQnty is 16.
- Service Level: This is a statistical measure to quantity the probability that an item will be in the warehouse when the next order is received. One minus the Service Level probability is the probability of a stock out. For example, if there’s a 95% service level for a given product, then there is a 5% chance of a stock out at any given time.
- Lead Time Months: This is the number of months required for the time a new Purchase Order is confirmed with a vendor until the time that the stock replenishment is received in our warehouse.
- Case Qnty: This customer sells by eaches and cases. This is the number of units in a case.
- Status: Active or Inactive
- ROP: Reorder Point
- OUL: Order Up To Level
- Lvln: Product Hierarchy level. The levels are a bit artibrary–Segment, Line, Family and Type, but it is meant as a way to logically organize products. In addition to being able to perform summaries by the hierarchy, some systems allow you to set up customer discounts based on the product hierarchy. There are many uses for a product hierarchy, but that is beyond the scope of this post.
Customer Master Table
Our Customer Master table (MasterCust) is rather basic in that it does not even the customer location, other than state, but it does serve its purpose.

Each of the fields is as follows:
- Name: Customer Name
- Top 10: Logical to reflect if this is one of business’ Top 10 customers
- CustGroup: Field to group like customers into a single group name
- State: State for bill to address
Sales Rep Master
This is a simple listing of the sales reps. If desired, you could group sales reps by region or territory to produce summaries. But in our example, we have a small number of sales reps.

Each of the fields is as follows:
- Rep: The short rep name, usually the first name.
- RepName: The full rep name.
Month-End Inventory Transactional Table
This table is used for a number of analyses, including looking at how many days of inventory are hand for each item, as well as reorder statistics.

Each of the fields is as follows:
- PartNum: Part Number
- ME_Date: Month End date in YYYY-MM format
- On_Hand: Quantity on hand at month end
- dME_Date: The number Month-End Date
- Ext_Cost: The extended cost of the inventory at month end.
Daily Shipment History Transactional Table
Each record in this table was a line item on an invoice.
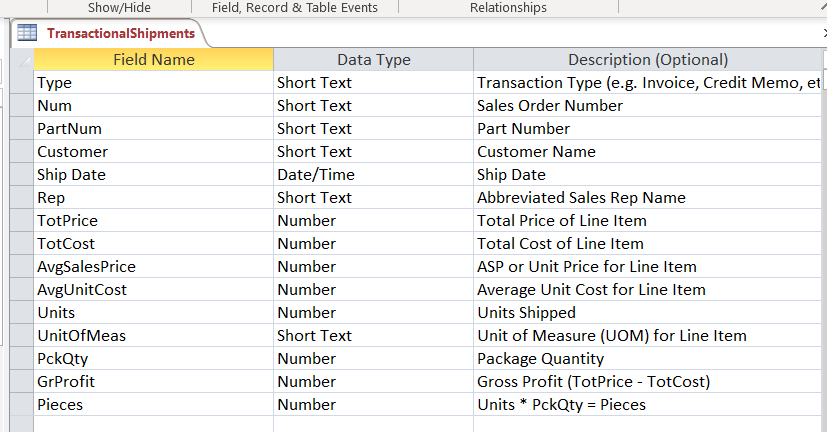
Each of the fields is as follows:
- Type: Transaction type, e.g. invoice, credit memo, debit memo, etc.
- Num: Sales Order number
- PartNum: Part/Product number
- Customer: Customer name
- Ship Date: Ship date
- Rep: Sales Rep
- TotPrice: Total price for the line item on the invoice
- TotCost: Total cost for the line item on the invoice
- AvgSalesPrice: Average Sales Price (TotPrice / Units Shipped)
- AvgUnitCost: Average Unit Cost: (TotCost / Units Shipped)
- Units: Units shipped
- UnitOfMeas: Unit of measure (units, ounces, pounds, feet, etc.)
- PckQty: Pieces in a unit pack. So if 1 pound and UOM is ounces, the PckQty would be 16.
- GrProfit: This is the result of TotPrice – TotCost
- Pieces: This is Units * PckQty. If an invoice sold 10 items at 16 ounce each item, there would be 160 ounces. Our data warehouse could then compute the profitability down to the ounce, if desired.
Outstanding POs is a transactional table
This table when combined with reorder points and units on hand provides some helpful information when making purchasing decisions.
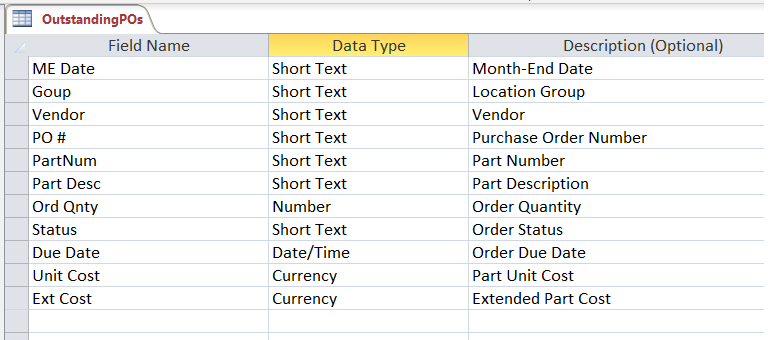
Each of the fields is as follows:
- ME Date: Month-end date in YYYY-MM format
- Group: Physical inventory location
- Vendor: Vendor
- PO #: Purchase Order Number
- PartNum: Part/Product Number
- Part Desc: Description
- Ord Qnty: Order Quantity
- Status: Purchase Order Status
- Due Date: Purchase Order Estimated Receipt Date
- Unit Cost: Unit cost from vendor
- Ext Cost: Extended cost from vendor
Reorder Levels is a Master Data table, sort of.
We just use this table to update the ROP and OUL metrics in the MasterProdHier table.

Table Relationships for our Data Warehouse
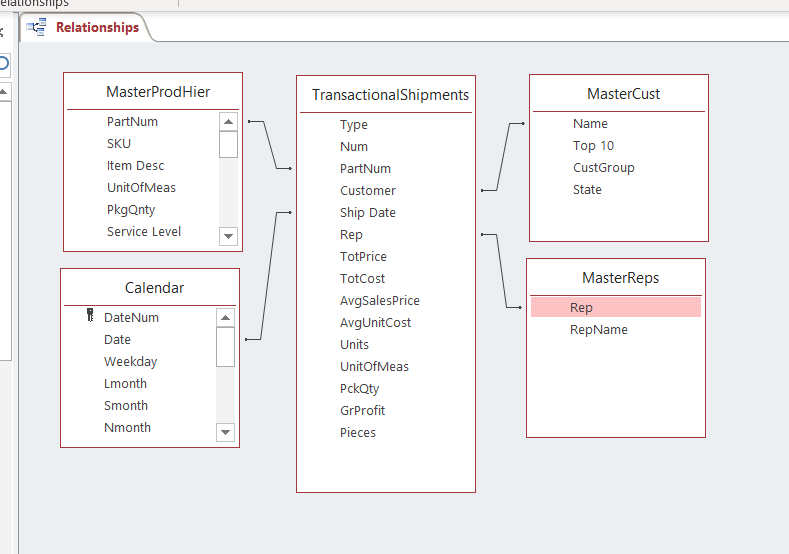
These are the relationships we established in our data warehouse. As you can see, the TransactionalShipments is the central table in the application.
Data Transformation
One thing that we did not address how to retrieve both master and transactional data from the accounting/ERP system to this data warehouse. Given that there are so many different accounting/ERP systems, we decided to ignore that aspect for now. This example was sourced from a Fishbowl Inventory system using both SQL data exports and some CSV exports.
If you would like to learn more about transforming CSV files from Fishbowl standard reports, please see our post from September 2018 to learn how we do just that. This will be the platform that our data warehouse will utilize moving forward. If you would like a copy of this Access file, please reach out to us. Also, please join our mailing list for notifications and special offers from Profitwyse.
If you are a business owner that is looking for ways to leverage your data analytics, please contact us today.

Other relevant posts:

