The Final Key To Improving Cash Flow — How to Compute The Cash Conversion Cycle and Better Manage Working Capital
Why is Knowing How to Compute The Cash Conversion Cycle (CCC) Important to my Business?
Understanding how CCC affects the ways in which a business utilizes its most precious resource–CASH–is a categorical imperative for all business owners. By monitoring CCC results combined with understanding and influencing the metrics that underpin the CCC metric will pay huge dividends and increase your business’ viability well into the future.
The CCC metric pulls together three other working capital metrics we posted about earlier–Days Sales Receivables (DSR), Days Inventory On Hand (DIOH) and Days Payables Outstanding (DPO). A CCC metric is computed as follows:
DSR + DIOH – DPO = CCC (lower the better!)
You are probably thinking, “that’s it?” Well yes, that’s it. I know it appears a bit abstract at first. But once you have finished this post, you will have an excellent understanding of how to better control your cash flowing using this working capital metric.
If you do not already have a good grasp on DSR, DIOH or DPO, use the links above and review those posts first, then return to this example where I pull it all together for you.
Are you back? Great, let’s get started…
An Example Illustrating How CCC Correlates to Cash Flow Management
In this simple example, we are going to follow a bicycle gear through a business cycle (i.e. purchase part, create inventory, pay vendor, invoice customer and collect cash) to illustrate the CCC. Assume that the hypothetical business is a bicycle wholesaler, selling assembled bicycles to retailers in the area. The business purchases bicycle components and assembles them into finished bicycles, based on their customer’s orders and specifications. All sales are on credit, invoiced with 45-day terms from shipment date.
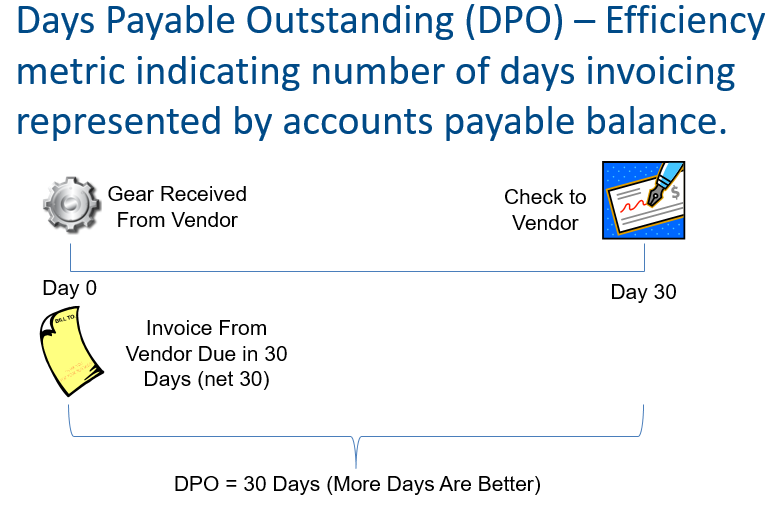
Step #1: Purchase Bicycle Components (Gears) From Vendor (This is the DPO component of the CCC)
Without bicycle parts, our business does not have much to sell. The person responsible for purchasing issues a Purchase Order for bicycle gears. Assume that we have negotiated 45-day payment terms with our bicycle component vendors.
The 45-day payment clock does not start until the inventory arrives at our facility. With that arrival, we post a debit to inventory and credit to accounts payable. Now we are just awaiting the actual invoice to arrive. But the date the invoice arrivals is not the starting date. The start date is when the gear is received at our facility and are entered in the inventory management system.
From our illustration below, you can see that the gear arrives on Day 0, along with the vendor invoice (that vendor is speedy). Per our negotiated terms, we issue a check to our vendor on day 30.
Step #2: Assemble a Bike to Our Customer’s Specification. (This is the DIOH component of the CCC)
Assume that we are starting another clock, which is actually the DIOH clock, on the day we receive the gear (Day 0 below). We maintain the gear in our inventory until we receive an order for a bicycle that specifies our gear in a Bill of Material (BOM), at which time the gear is “consumed” in the finished bicycle assembly process to create a finished bicycle. View the illustration below.
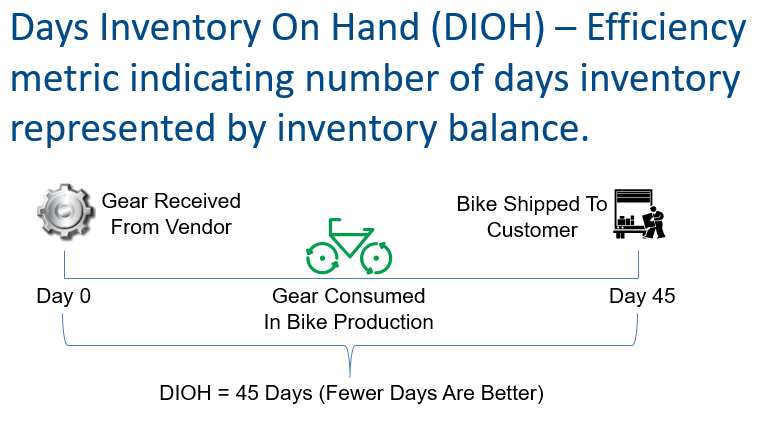
In our example above, we received the Gear on Day 0. More than likely it idled in our inventory for a couple of weeks before receiving the order from our customer. At that point, we quickly created a work order, assembled the bike and closed the work order as complete. Then 45 days following the date we received the Gear, we shipped the bike (including the gear), as part of a finished bicycle to our end customer. Given that we held the Gear for 45 days, our DIOH is 45.
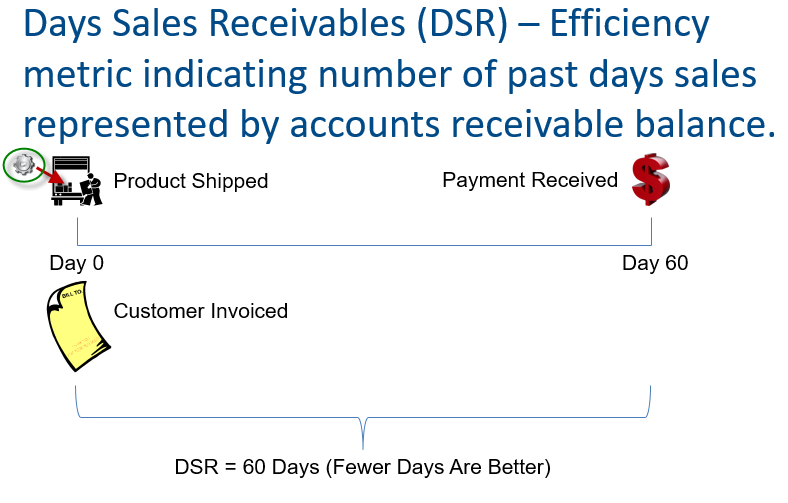
Step #3: Ship Bicycle, Invoice Customer and Collect Cash (This is the DSR component of the CCC)
As you can see in the illustration below, our Gear is being loaded, as part of the finished bicycle, into the truck on Day 0. Once again we are starting another clock, which is our DSR clock. This clock begins, essentially, on the day the inventory item leaves our facility. There are nuances like FOB Source or Destination, but those distinctions are for another day.
This is a good customer given that we have extended 60-day payment terms. We are able to get the invoice out on Day 0 because our ERP system emails invoices automatically. Then as you can see below, on Day 60 we receive the check that stops the DSR clock on this shipment at 60 Days.
Collections is one of the most important business process functions you will oversee. It is critical that invoices are issued in a timely and accurate manner. Extending 60-day terms is rather generous, but in our example, this is a stellar customer. They pay on time and do not load us up with claims for chargebacks; consequently, we decided to extend generous credit terms.
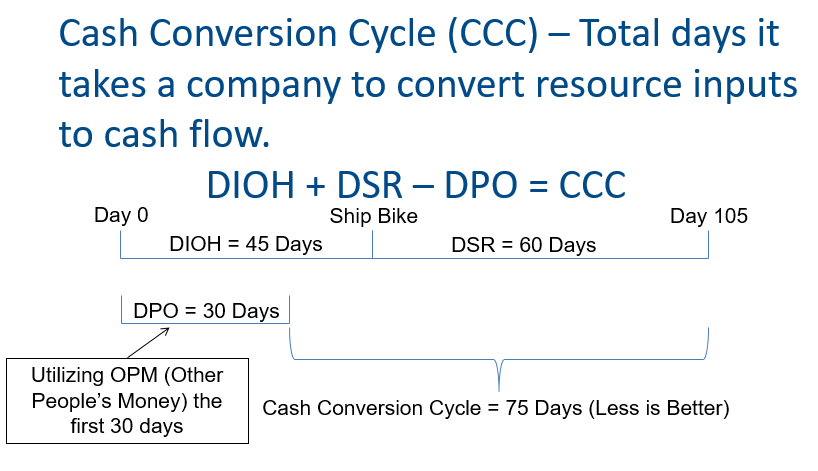
Step #4: Pulling It All Together — Cash Cycle Days
Finally, we have all the pieces and can compute our CCC metric. You can see in the top section of the graphic below, when adding the current asset parts–DIOH and DSR–you get 105 Days. Then when you subtract DPO, the net is a Cash Conversion Cycle equal to 75 Days. Hopefully the illustration makes it clearer why you subtract the DPO from DSR + DIOH. The reason is that are taking advantage of OPM (Other People’s Money). The business did not have to disburse a dollar until 30 days into the CCC time frame. You, as the business owner, spent your first dollar on Day 30. Subtracting the 30 Day DPO from the 105 Days DSR + DIOH, gets you to a CCC of 75 Days.
You can see from the above that the CCC is effectively the number of days from when you disbursed the first dollar until you are able to collect that same dollar (metaphorically of course, but money is fungible). Obviously the fewer days the better, which you can think of as the velocity of money circulating in your business. A lower CCC equates to a higher velocity. A higher velocity of money translates into lower levels of debt required to sustain your inventory and credit policy. Less debt also means more cash in the bank account at month end and lower interest expense.
I have heard the term “Your Vendors Are Your Lenders,” how does that work?
Large retail companies, such as Walmart, that have significant leverage over their vendors, can approach and in some cases achieve a negative CCC. Given that retailers do not generally have to extend credit, because most of their sales are cash, they will effectively have a 0 DSR. If these businesses can negotiate 45-day terms with their vendors and maintain a very lean inventory, then they can potentially approach a negative CCC. Conceptually, what is happening is that these businesses are able to sell inventory prior to having to pay the vendors that provided the inventory. Even this is difficult for Walmart since a large amount of their inventory is sourced from China. You can bet Walmart has negotiated agreements where they do not pay their vendors until the product has, at the earliest, been received in the U.S.; otherwise, Walmart could not achieve the DIOH levels they regularly achieve (41 DIOH as of YE 2019).
Tools You Can Use to Monitor Your Cash Conversion Cycle Performance
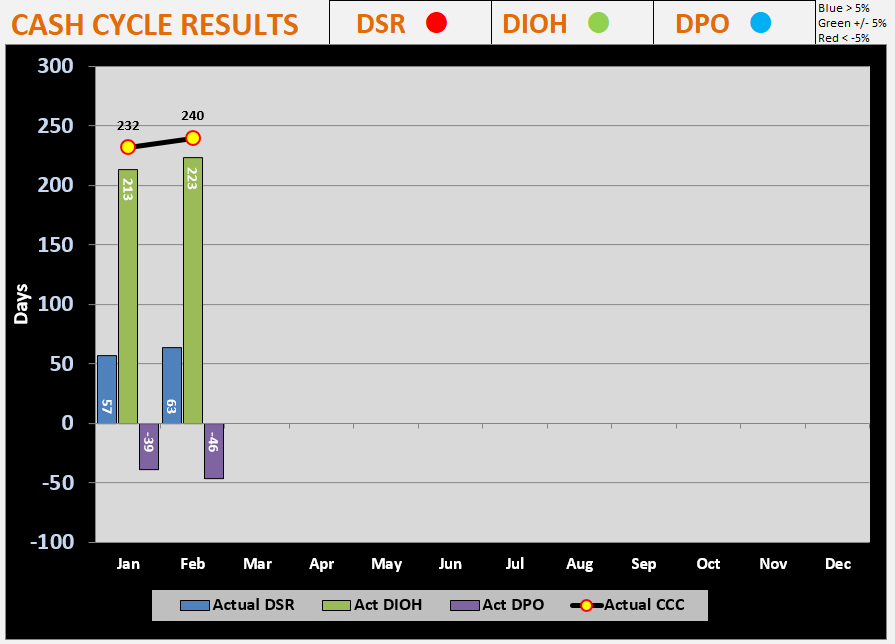
Below is a graph format we use with clients to help monitor and influence their cash flow by reviewing DSR, DPO, DIOH and CCC. In the graph below, DSR, DIOH and DPO are represented a columns and the CCC is represented by the line. You can see that this client needs more focus on managing their current assets given their CCC was at 240 days as of ME February.
In addition to the graph, we added some key indicator lights toward the top right to reflect the month-over-month change. So if a key metric is 5% worse than the prior month, the indicator is Red, better the 5% over the prior month is Blue and between the two is green. This provides a quick review of how the metrics have changed over the prior month.
We hope you have a better sense for managing your company’s Cash Conversion Cycle and can implement some of the ideas we have presented in this blog post. We are sure they will pay significant dividends in the near future. If you would like a copy of the above graph, use the Contact Us link below to reach out and request a copy. Additionally, if you are a business owner that is looking for ways to leverage your data analytics, please contact us today .